Aligning and Cascading KPIs
How to align KPIs to strategy and cascade KPIs throughout the organisation.
Aligning KPIs means that all KPIs or performance measures within an organisation correctly relate to one another, and to the things that matter most for the organisation, like its strategy and purpose.
These relationships between KPIs make it possible for everyone to see how they contribute to the organisation in the best possible way to excel at what it exists to do.
One of the most important keys to successfully aligning KPIs and performance measures to strategy is make sure your strategy is measurable in the first place! In particular, look out for:
- weasel words (like efficient or effective or quality or outcome) – they don’t have clear enough meaning
- action-oriented goals that fail to articulate the intended performance results
- what exactly you are trying to measure (people versus process)
These resources will help you take a more critical look at your strategy, and make it measurable before you cascade it and align KPIs to it (email this page to yourself or a friend):
- Step 1: Choose the model of cascading that suits your organisation.
- Step 2: Consider relationships between KPIs beyond cause-and-effect.
- Step 3: Create a visual model of how KPIs relate to goals, at each level in the organisation.
- Step 4: Help everyone see how their work aligns to the KPIs and goals.
- Step 5: Use the KPI alignment to improve performance with more leverage.
- Bonus: Learn more about aligning and cascading KPIs on the Measure Up blog.
Step 1: Choose the model of cascading that suits your organisation.
Cascading KPIs is the process of setting the right KPIs for business units and teams to measure, that are relevant to the strategy and purpose of the organisation. We don’t want to measure what’s easy or obvious or traditional. We want to measure what helps us make the decisions relevant now.
We don’t really cascade KPIs or performance measures. We cascade strategy, or the goals that comprise it. And then, using a deliberate measure design technique, we establish KPIs for each goal at each level of the cascaded strategy. This means our KPIs will automatically be aligned to strategy, and cascaded to the right parts of the organisation.
There are two ways to cascade strategy. One method is to cascade through the functional structure of our organisation. The other method is to cascade through the business process flows of our organisation. Neither one is right or wrong, but the business process method makes the most sense to me, and makes it easier for us to find the fundamental performance improvements that last.
Many people have trouble cascading strategy into support functions, like Finance, Procurement, or HR. But it becomes much easier when see that these support functions don’t always directly link up to the organisation’s corporate goals. But support functions can link directly to the goals of their internal customer business units.
Step 2: Consider relationships between KPIs beyond cause-and-effect.
Most often, people assume that the cause-effect relationships between KPIs matter most. Sure, they’re useful for helping diagnose a KPI’s trend by looking at its cause KPIs. And we can use current trends of KPIs to predict future performance in their effect KPIs. For example, we can use this method to find the right improvement initiatives for a lag measure.
But there is more to KPI relationships than cause-effect. There are three types of performance measure or KPI relationships that are important:
- cause-effect: when one measure improves or deteriorates in performance, it causes another measure to improve or deteriorate in performance as a consequence
- companion: each measure tells a part of a complete story of performance, so if we relied on just one of the measures, we wouldn’t have a full enough picture to take the best action
- conflict: improving one measure causes another measure to deteriorate, so we need to consciously balance the trade off
We need to figure out which relationship type exists between the KPIs we are aligning and cascading. But without falling into the trap of making everything relate to everything! We need to focus on the strongest relationships that will influence our decision making.
Step 3: Create a visual model of how KPIs relate to goals, at each level in the organisation.
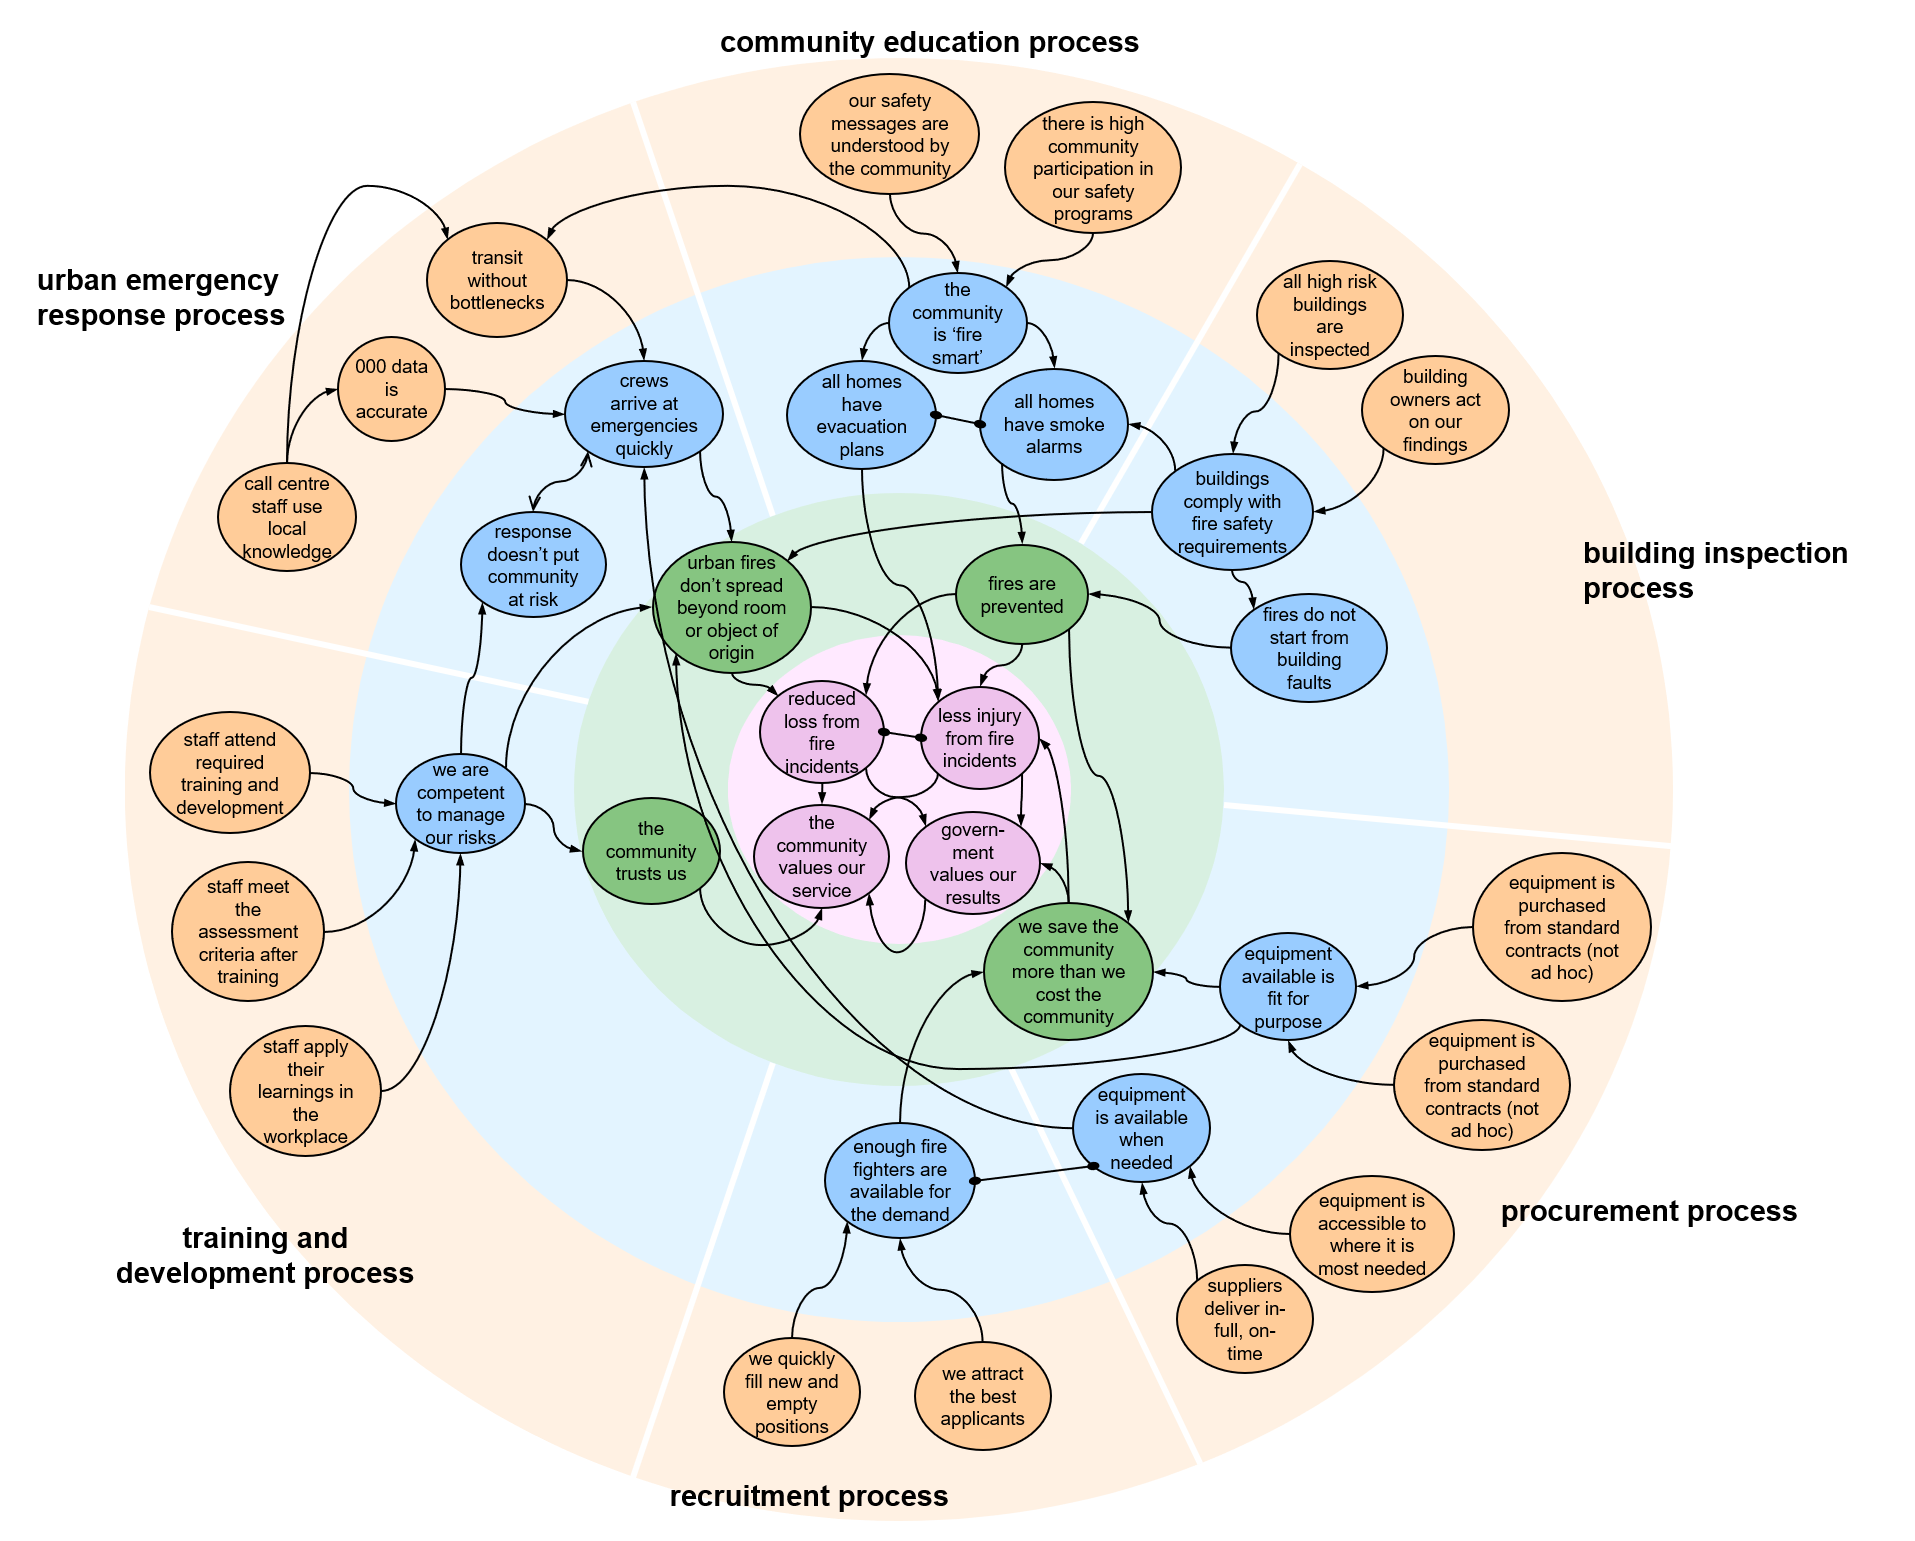
A visual model for mapping how KPIs or performance measures align to goals is the easiest and fastest way to engage people. Lists and pyramids and flow charts don’t work as well as something like the PuMP Results Map (more about PuMP here). Neither do the disjointed tiers of Strategy Maps that can get confusing and repetitive. A Results Map puts it all on a single diagram. That diagram shows the levels of KPIs, attached to the goals we have cascaded from top to bottom. So our KPIs are then directly aligned to their relevant goals.
The PuMP Results Map is also a brilliant layout to help us make sense of the different types of KPIs or performance measures that matter. There are lead and lag measures. There are input and output measures. There are strategic and operational measures. There are endless frameworks or classifications that consultants have published for KPIs. But few of them help us. They aren’t comprehensive ways to classify our KPIs, and lead us to confusion.
But with the Results Map, we can see that it doesn’t matter so much which classification bucket we put our KPIs into. What matters more is how they link to the results that matter most to us, and how they link to one another.
Step 4: Help everyone see how their work aligns to the KPIs and goals.
It can be tempting to try and directly cascade strategy to individual employees in single leap from corporate to personal goals. But that doesn’t work. We can’t get meaningful alignment of KPIs by giving everyone a “mini me” copy of the corporate goals. It is a leap that’s simply too far and disconnected. And it causes people to become disengaged, or make up trivial or illogical links between their work and the corporate direction.
To align individuals to the corporate goals, we need to do is build a clearly cascaded model of goals through the natural layers of the organisation’s structure. And then it provides a clear “line of sight” to individuals to see their own local goals. Their local goals will be relevant to them, within their circle of influence, and still aligned to what is corporately important.
Step 5: Use the KPI alignment to improve performance with more leverage.
Improving each individual KPI, on its own, seems like a natural way to use KPIs for performance improvement. But this tick-and-flick method of using KPIs in isolation too often leads us to suboptimise each area of performance, like applying a quick fix to reduce cycle time without seeing that the real problem is too much rework. Or we sabotage other areas of performance, like minimising costs at the expense of quality. That’s because of the relationships that measures or KPIs have to one another (see Step 2 above).
True performance improvement isn’t in the KPIs, it’s in the spaces between them. This is why the relationships between and among our KPIs are so important. So we need to use our KPIs as a suite or collection of information. We need to understand the full story of a particular domain of performance, like a strategic theme or a business process, or a functional area. Sometimes we also need to dive below the surface of our KPIs, to get a fuller story from the data.
Bonus: Keep learning more about aligning and cascading KPIs on the Measure Up blog.
There is a continually growing collection of tips about improving performance with KPIs on the Measure Up blog.
Connect with Stacey
Haven’t found what you’re looking for? Want more information? Fill out the form below and I’ll get in touch with you as soon as possible.
167 Eagle Street,
Brisbane Qld 4000,
Australia
ACN: 129953635
Director: Stacey Barr
Free KPI Tips In Your Inbox
Sign up for our Measure Up email tips and immediately get free access to the "10 Secrets to KPI Success" online course!
We respect your email privacy.