Three Types of Performance Measure Relationships
by Stacey Barr |If you think about when organisations work well, it’s because all the parts are coordinated together and managed as an integrated whole. And that’s a very good reason why we ought to treat our performance measures the same.

By understanding how measures are related to one another, we increase their power to help us understand and diagnose performance, and thus how we can report those measures together to facilitate a more holistic response to performance improvement.
Relationship 1: Cause-Effect
As the most commonly talked about relationship between measures or KPIs, the cause-effect relationship isn’t too hard to understand. It simply means that when one measure improves or deteriorates in performance, it causes another measure to improve or deteriorate in performance as a consequence. For example:
- reducing rework can cause costs to reduce
- improving recruitment of talent can cause workforce capability to improve
- if employee engagement slides then it can cause customer satisfaction to slide too
Cause-effect relationships are often not linear or isolated, though. One KPI’s performance is mostly likely affected by several (or many) other KPIs.
Relationship 2: Companion
Measures have a companion relationship when they each tell a part of a complete story of performance. If we relied on just one of the measures, we wouldn’t have a full enough picture to take the best action. For example:
- number of new prospects and prospect conversion rate are companions to track a marketing process
- customer lifetime value and number of active customers are companions to understand drivers of profit
Relationship 3: Conflict
Because we can’t have our cake and eat it too, we often can’t maximise the performance of any one measure. Other measures of performance can pay the price, and that’s where you get conflict relationships between measures. For example:
- improving workplace safety can conflict with on-time delivery to customers
- reducing call handling time (in a call centre) can conflict with first call resolution
- improving product quality can conflict with cost reduction
These relationships are easier to find and understand by mapping them.
Look at one of your organisation’s performance reports, and the suite of measures or KPIs it includes. How are these measures related to one another? Does this appreciation of the relationships suggest any opportunities to improve the way your report the measures, so they are more useful?
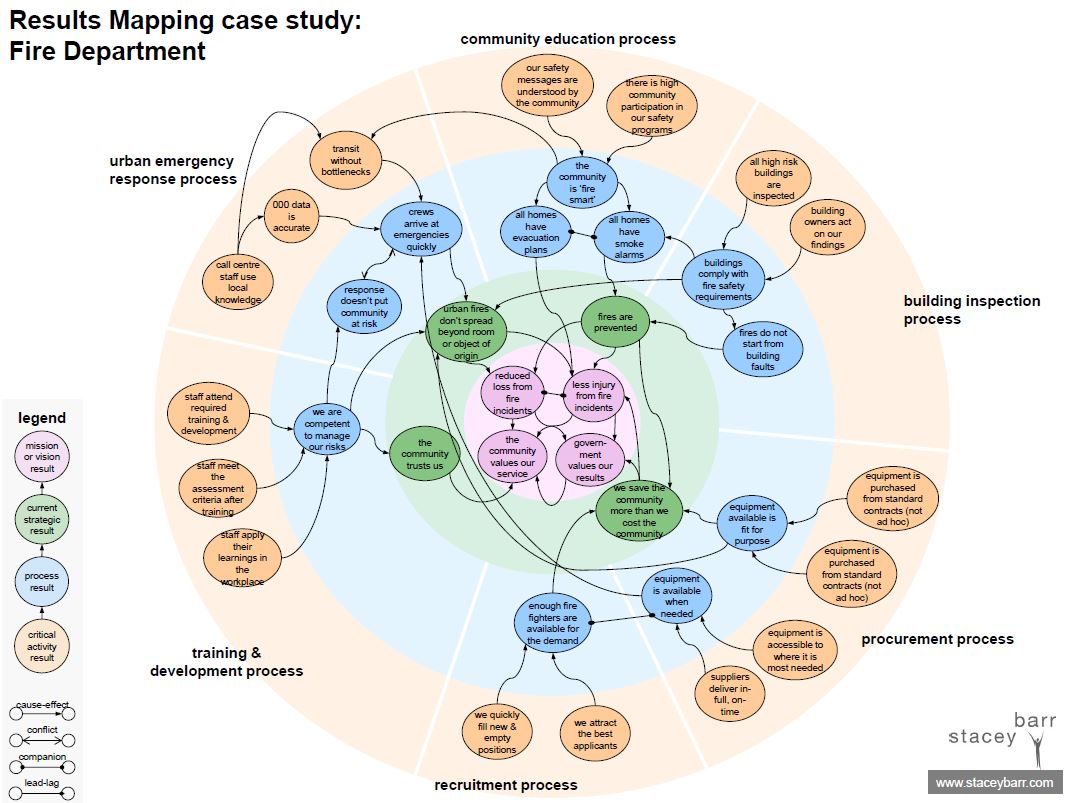
One brilliant tool to help you explore and identify the most important cause-effect, companion and conflict relationships among your performance measures is PuMP’s Results Map. It might look a bit overwhelming at first, but it takes just a few minutes to understand what it’s doing and how it works… and you’ll likely get addicted to the vastly improved perspective it gives you on managing performance.
Join Measure Up
Sign up for the Measure Up newsletter and get free access to the "10 Secrets to KPI Success" online course and e-book.

Upcoming KPI Training
>> Australia/NZ/Asia Pacific, Wellington NZ, 7-9 May 2024
>> Africa, Cape Town SA, 8-10 May 2024
>> UK & Europe, Online Interactive, 10-14 June 2024
>> North America, Online Interactive, 3-7 June 2024
>> USA, Washington DC, 25-27 June 2024


Connect with Stacey
Haven’t found what you’re looking for? Want more information? Fill out the form below and I’ll get in touch with you as soon as possible.
167 Eagle Street,
Brisbane Qld 4000,
Australia
ACN: 129953635
Director: Stacey Barr