5 Tips For Setting Up KPIs in Spreadsheets
by Stacey Barr |When it’s not possible to automate your performance measure or KPI’s calculation, a spreadsheet is a good interim solution, if you follow these 5 tips for setting them up.

There are several situations in which it makes sense to get the data for your measures or KPIs into a spreadsheet, rather than try to automate them in a dashboard:
- For new measures or KPIs, you get to see how to format or prepare the data to calculate those measures’ values, and iron out any bugs.
- When you don’t have time, or your dashboard team doesn’t have time, you can get a couple of useful measures set up more quickly.
- You may not even have access to an automated system, like a dashboard.
Assuming you have the raw data for your measure or KPI, a spreadsheet can be a quick and easy way to bring your KPI to life. A spreadsheet can capture, calculate and maintain the measure values in a format that makes it easy to import into an automated system in the future. And, until that future time, you can also use the spreadsheet to visually monitor your measure over time.
Believe it or not, I still use a spreadsheet for my own KPIs! And for it to be fast and easy, there are 5 tips that I always follow. If you need to use a spreadsheet to calculate your measure values, ready for graphing, these tips will make it easier for you too…
Tip 1: Use one worksheet per measure (for easier navigation).
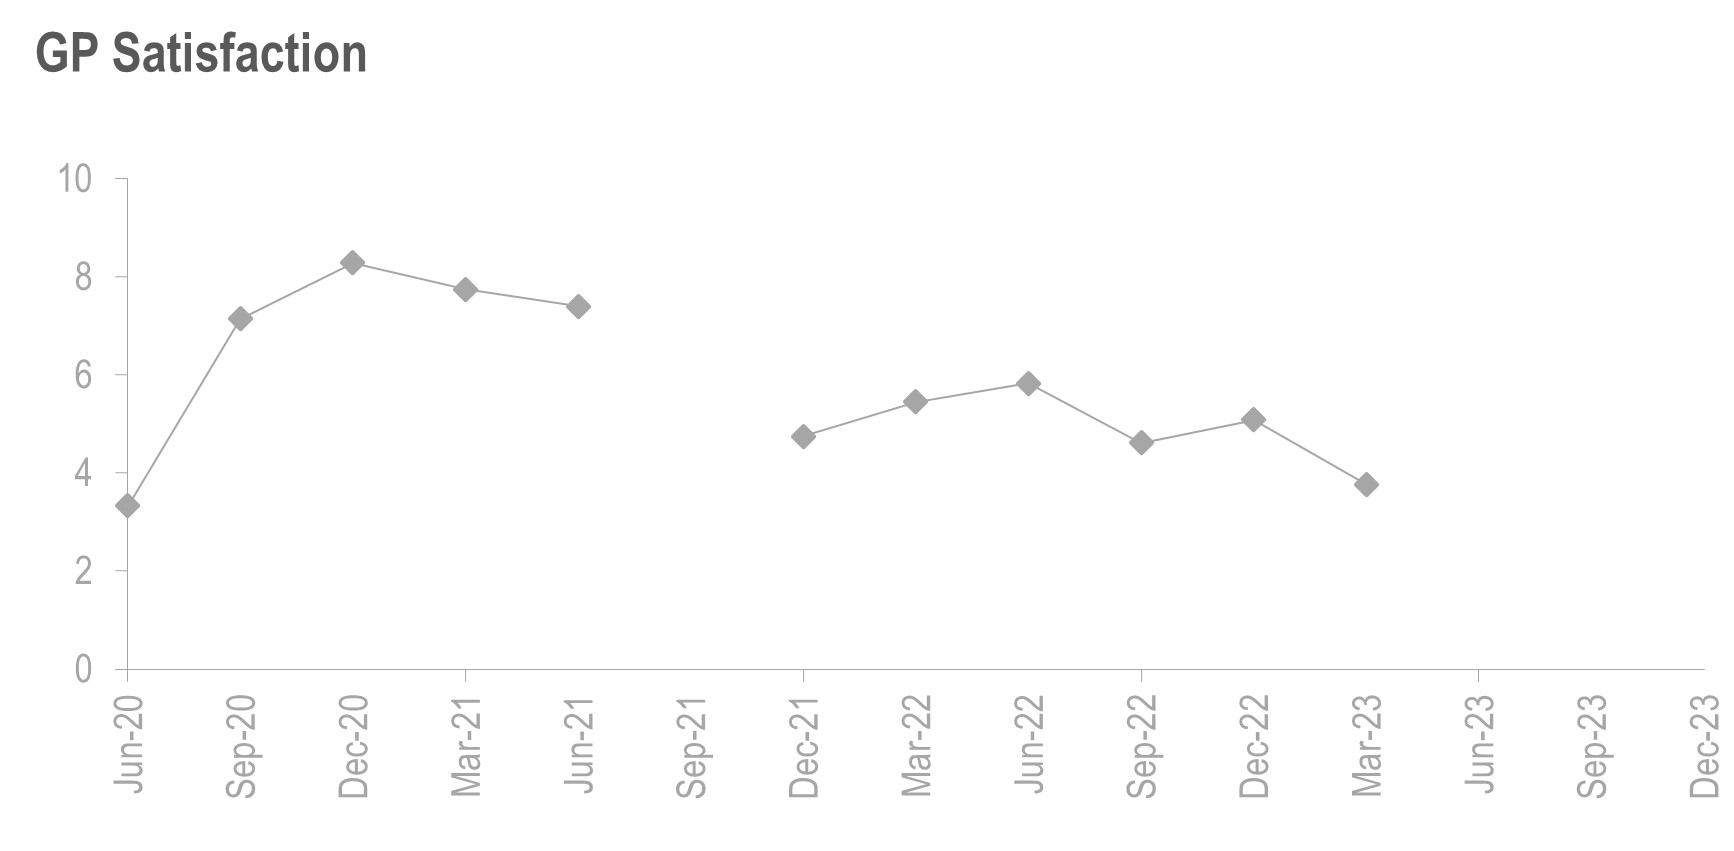
Firstly, however, if you’re starting with raw data, use a separate worksheet to summarise the raw data, first. For this sample measure, of Overall Satisfaction, the raw data is the respondent level data from a survey you might do in your team or business.
This data needs to be summarized before it becomes a measure value. We want the measure value to be the average satisfaction rating per quarter, so this spreadsheet does that for us. There may be other apps you can use to get this summary level data, but doing it yourself, like this, you can see what’s happening.
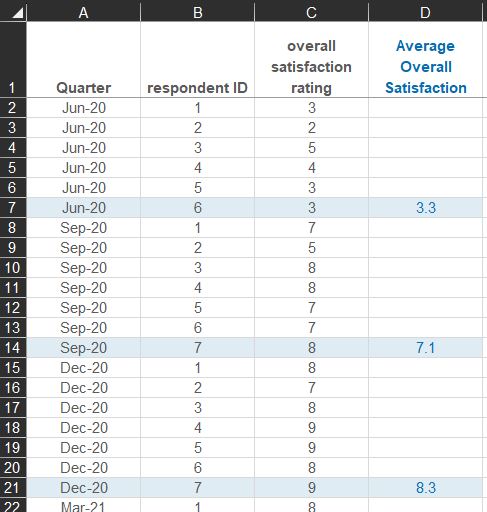
And then these values will be linked to another spreadsheet, just for the measure values.
Tip 2: Arrange the measure values in columns, not rows (for easier graphing).
Many times in the past, I’ve had to use client data that was arranged in rows. It was cumbersome to work with, for two reasons. Firstly, you can see more of the data in one screenshot when it’s arranged in rows. Secondly, it makes it easier and neater to graph the measure values using my favourite KPI graph, the XmR chart.
So, for this Overall Satisfaction measure example, notice there is a column for the dates, and column for the measure values.
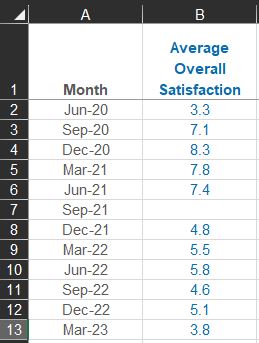
You’ve probably noticed the missing value for September 2021…
Tip 3: If there are missing values, leave them blank (for a true time series).
Gaps in our data are part of its context. A zero value is a zero. But if we failed to collect data for one specific time period, like how, in our example, the survey wasn’t done in September 2021, we keep it as a blank or missing value.
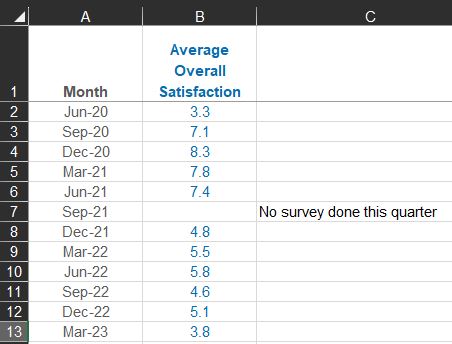
If the value is missing by mistake, obviously we go back to the raw data and see if we can now calculate that measure value. However, if we have lots of missing values, maybe we’re trying to measure too frequently, where the result we’re measuring just doesn’t happen as often as we thought. In that case, we can change the frequency or cadence of our measure.
Tip 4: Start with a minimum of 5 measure values (for statistical validity).
The first five measure values help us get a performance baseline. That means a clear indication of the starting level of performance which we then compare against, as we start to solve problems and improve performance.
We have more than five values here for Overall Satisfaction, so we’re okay this time. But for any new measure where we have less than five consecutive values, we don’t have enough to draw any conclusions yet. Performance measures track results over time, and it’s the patterns over time that have the insights, not the individual measure value points.
Imagine that you went back in time to September 2020, and had just those first two measure values for Overall Satisfaction. What conclusions would you draw?
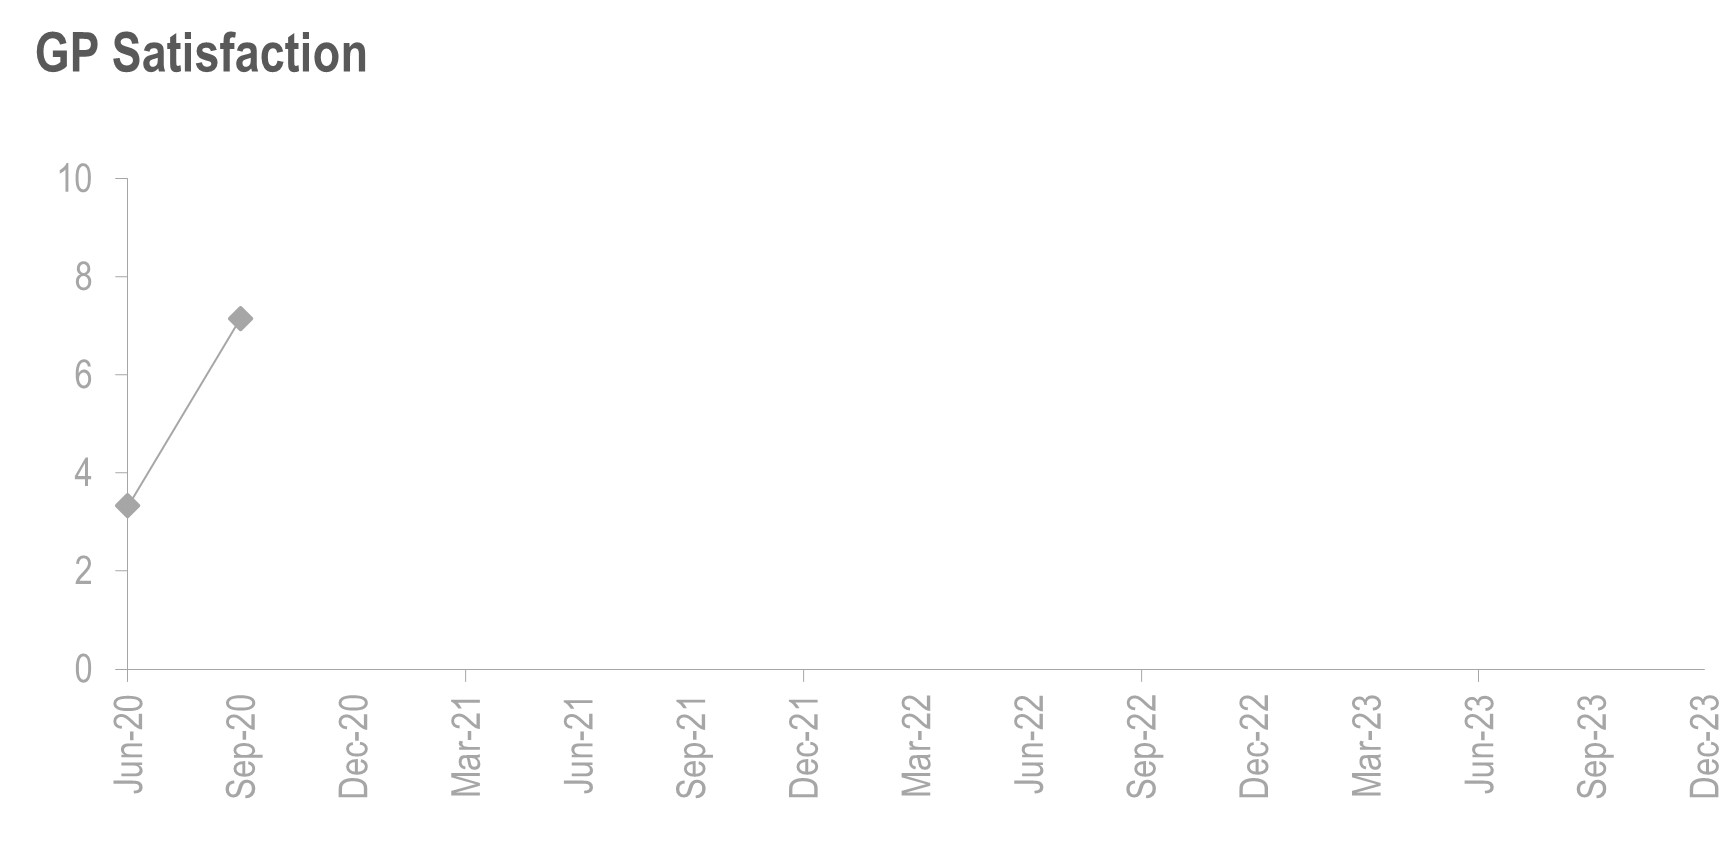
Now return to March 2023, where you have 11 measure values for Overall Satisfaction. What conclusions would you draw now?
Likely, you’d see how invalid the conclusion was that you drew from just the first two values. Context is essential for interpreting our measures.
Consequently, if we’re measuring something annually, we can’t get much insight from that. Obviously, five years is way too long to wait. So in those cases, we consider measuring more frequently if we can, or we measure something that is a lead indicator of the annual result.
For example, we might only be able to reliably measure profit until the end of each financial year, but we can measure revenue and costs every month to get insights about patterns over time. Even quarterly is too infrequent to get feedback about many typical performance measures in business.
Tip 5: Use historic data, or build up to 20 to 30 measure values (for context).
If we have historic data for a measure, like Revenue or Staff Availability or Unpaid Bills, we use that to give us a starting context for performance. Patterns in the past will help us interpret patterns now, and as we move into the future.
If we don’t have much historic data, or none at all, we need to be patient and wait to build it up. But when we have it, we get such a clear story about performance. Like in this Unsubscribe Rate measure:
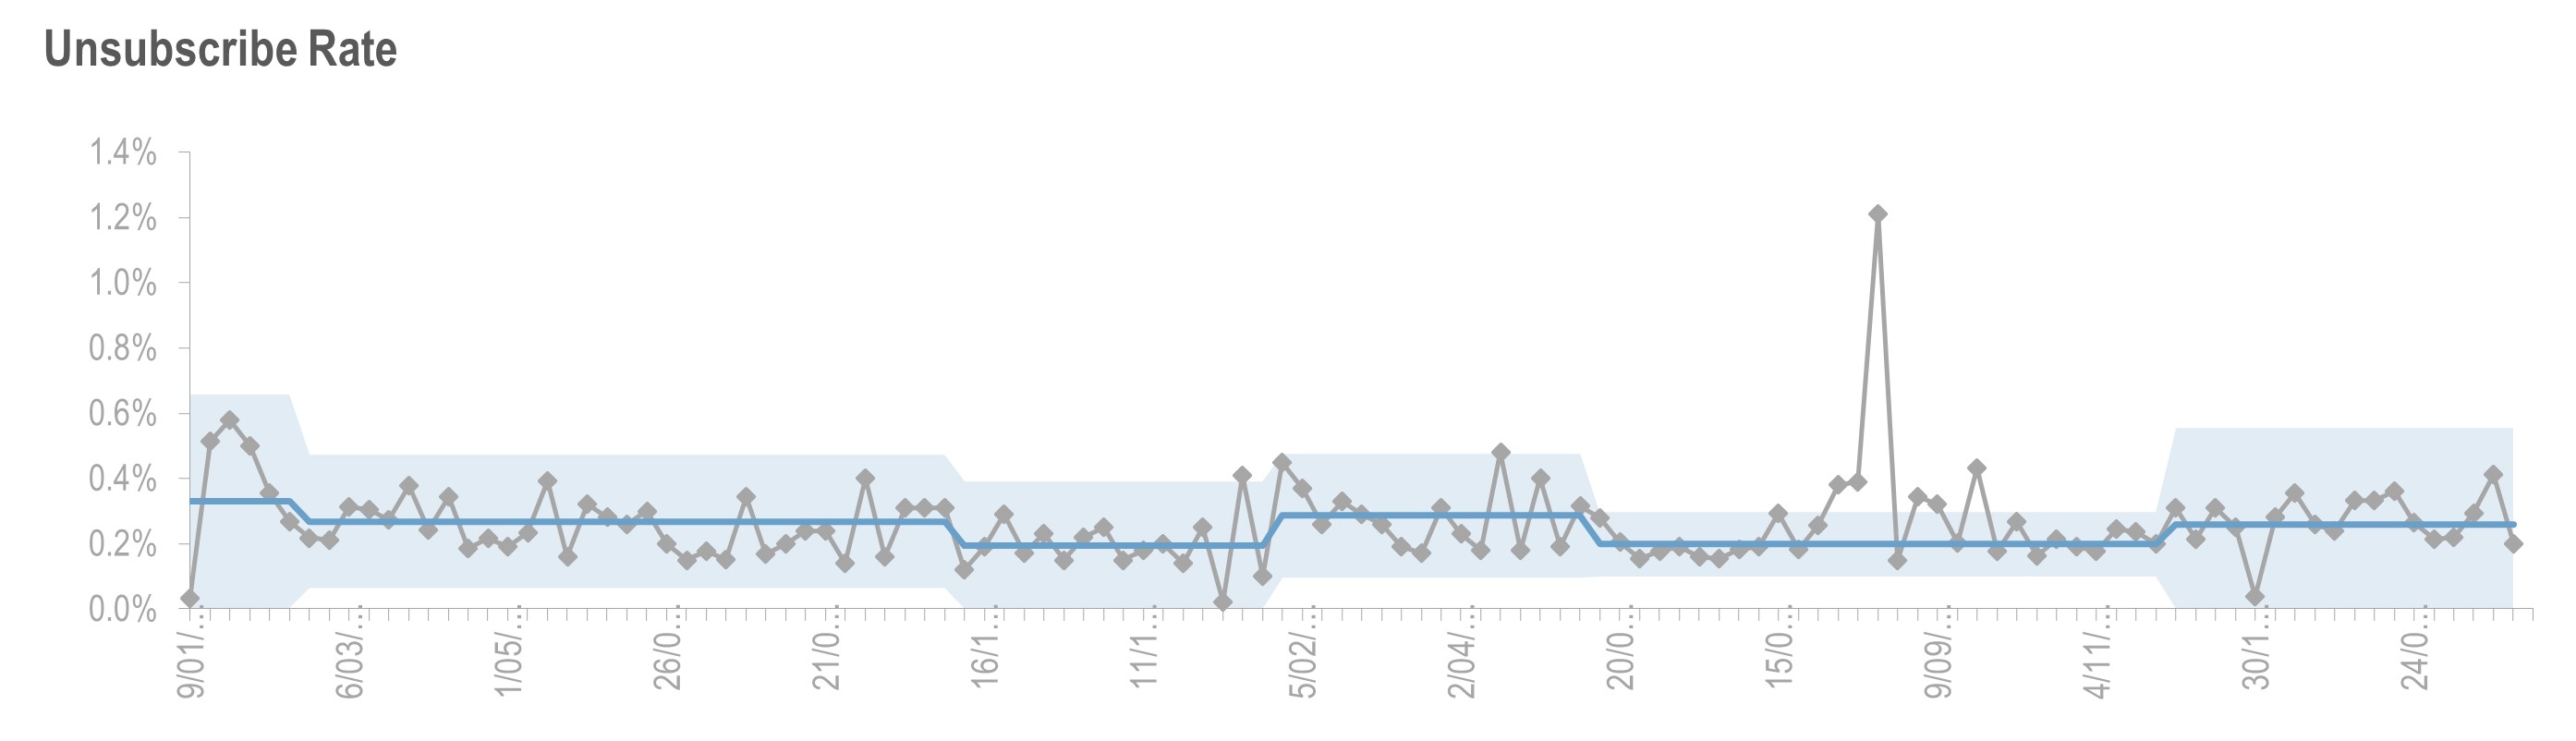
It’s easier to see, with all that history, that Unsubscribe Rate has, for the most part, almost predictable periods of higher versus lower rates. And the higher rates seem to be triggered by the arrival of the end of the calendar year. (I don’t yet have an explanation for the huge outlier – but there are clues that it’s from a spam attack on the subscription sign up form.)
***
It’s not ideal to have hundreds of different performance measures in dozens of spreadsheets, uncontrolled across a large organisation. But in smaller teams or small businesses, it can be a quick and practical way to at least get started with measuring some powerful KPIs.
Join Measure Up
Sign up for the Measure Up newsletter and get free access to the "10 Secrets to KPI Success" online course and e-book.

Upcoming KPI Training
>> Australia/NZ/Asia Pacific, Wellington NZ, 7-9 May 2024
>> Africa, Cape Town SA, 8-10 May 2024
>> UK & Europe, Online Interactive, 10-14 June 2024
>> North America, Online Interactive, 3-7 June 2024
>> USA, Washington DC, 25-27 June 2024


Connect with Stacey
Haven’t found what you’re looking for? Want more information? Fill out the form below and I’ll get in touch with you as soon as possible.
167 Eagle Street,
Brisbane Qld 4000,
Australia
ACN: 129953635
Director: Stacey Barr