How Does Each Step of PuMP Create Great KPIs?
by Stacey BarrPerformance measurement is a process. And when the steps of that process work well, like PuMP, we can easily create great KPIs.
Performance measurement, like anything, works when the approach is deliberate. W. Edwards Deming said “If you can’t describe what you are doing as a process, you don’t know what you’re doing.” And, if you can’t describe what you’re doing as a process, you won’t be able to improve it to get better results.
Can you describe your approach to choosing, implementing and using performance measures as a process? If you cannot, then what you likely have is the absence of a deliberate measurement approach. And without a deliberate approach, your KPIs won’t be great, and won’t do what they’re supposed to do.
PuMP is a deliberate measurement approach, and it has been continuously improved for about 25 years now. So it’s a great model of a measurement approach that does help people create great KPIs. And we can explain how it does that. And you can compare your approach to see how it’s similar or different.
One of the best explanations of what each step of PuMP does is by Louise Watson, our PuMP Partner for North America. She gave this explanation on a webcast we hosted together. Here, I share a slightly edited version of Louise’s explanation, with a little of my own input too.
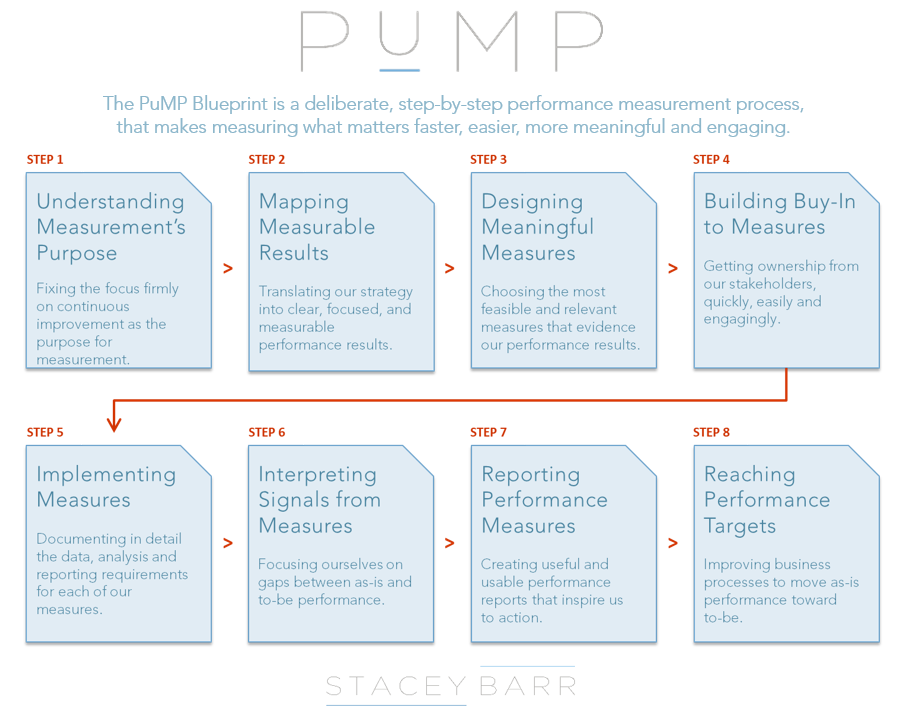
PuMP Step 1: Understanding Measurement’s Purpose
The real purpose of performance measurement is the continual improvement of processes, to improve the results that matter.
To help people arrive at the same understanding of the real purpose of performance measurement, we help people reframe their beliefs about it, and think differently about how they might overcome their struggles with it.
So we use this fantastic tool, which is really a conversation guide. It’s called the PuMP Diagnostic. It contrasts poor measurement practices with good practices, in the context of continuous improvement. It emphasises that measurement is not about judging and blame. It’s about learning and exploring and testing. This great conversation is almost a change management tool, reframing beliefs that hold people back from creating great KPIs.
PuMP Step 2: Mapping Measurable Results
The Measurability Tests in Step 2 of PuMP guides a conversation to figure why our goals are hard to measure. We don’t rush into measurement yet. There’s this important step we have to take first. We clarify those goals, so they do become what we call ‘measurable’. But not yet measured.
Every team maps the alignment of their measurable goals to the strategic direction. The tool that we give you for this is called the Results Map. It’s a way to visualise your strategy.
PuMP Step 3: Designing Meaningful Measures
PuMP deliberately separates Step 2 and Step 3, because we first have to deal with each symptom of a goal being hard to measure, and fix each symptom. Step 2 in PuMP creates the input to Step 3: measurable goals.
We use the Measure Design technique, which gives depth to the conversations we need to have to arrive at great KPIs. It helps us create potential measures that quantify the direct evidence of our goals. Then we can choose the potential measures that have the best balance between relevance and ability to implement.
None of this is about brainstorming! PuMP’s Measure Design step is better described as divergent thinking to explore possible KPIs, followed by convergent thinking to choose the best KPIs.
PuMP Step 4: Building Buy-in to Measures
For people new to a deliberate measurement practice, it can feel like there has been quite a lot of work at this point. But it’s good work: deeper thinking and constructive conversation. And now we have the opportunity to engage our peers in our work. We do this now, because the only way to ever get buy-in is to involve people.
PuMP provides a technique called the Measure Gallery, to create safe spaces to allow people to interact with the measurement work so far. The Measure Gallery is not only a safe space, but it’s also fast and easy, and a fun way for a lot of people to get involved and have input to the measures developed so far.
You’ll always be surprised at the quality of feedback that you get and the buy-in because we’re not asking people to sign off. We’re asking them to have a meaningful conversation with us. And it creates incredible buy-in to fuel great KPIs.
PuMP Step 5: Implementing Measures
With the great feedback and buy-in for a new set of KPIs, it’s time to bring them to life. In PuMP we use the Measure Definition technique, and it’s the real rigour that is the math of measurement. It is about quantification. It is about statistics. So we need to be pretty clear about how we’re going to define each of our KPIs.
The Measure Definition template is very comprehensive. It’s almost an implementation plan for each one of your measures. And it’s that comprehensive because we don’t want to leave measure implementation to chance. We want to make sure that how we bring our data to life is consistent and accurate. Once we apply that rigour, then we can then have data that we can rely on and trust, ready to draw conclusions from.
PuMP Step 6: Interpreting Signals from Measures
What’s really happening in our data? What are our KPIs telling us, that we need to pay attention to? This is what this step in PuMP is all about.
In PuMP, we use the technique called XmR charts. These charts have been around for quite a long time and they are available in other places, but we provide them to you in our training.
The power of seeing our KPI in an XmR chart is it that it actually shows signals in our measures that are based on proven statistical methods that don’t confuse random variation with real signals of change. They are a KPI visualisation that doesn’t make us react to variations from month to month. They focus us on real shifts in performance.
Performance measures are for improving performance, and we improve performance through our actions. So, we want to prove that our actions created the change wanted, or clean up our act and stop wasting time and effort on actions that didn’t create that change.
PuMP Step 7: Reporting Performance Measures
Once we start to learn how to visualise our data so that we can see true signals of change, then we can use these in our reporting. People use words like ‘business analytics’ and ‘insights’ as though they have some kind of shared definition. But when it’s about strategy execution, we want to really make sure we are talking about our performance measures in a consistent way.
So we design our dashboards and our reports using PuMP’s report design framework, which makes sure three priority questions are easily and quickly answered:
- What is performance doing? You can split that in two and say, where is performance moving towards target, where are things looking pretty good? And where is it not? Where does it look like we need to put more attention on a KPI?
- Why is performance doing that? What’s happening with what we’re not seeing signals of change? Even if we’re spending tons of money on execution, why aren’t things changing?
- And now, what are we going to do about it? Reports should inspire us to do something about things that are not going well.
We don’t want to clutter reports with chart junk or activity minutia. People think that more is better. But when we’re trying to execute strategy, we need very specific reports that only answer those three critical questions.
PuMP Step 8: Reaching Performance Targets
PuMP is actually a very powerful strategy execution framework that has this lens of measurement around it. PuMP’s Step 8 is when we’re at full-on strategy execution. And full-on strategy execution is all about how can we find better ways to close our performance gaps?
We use a framework that uses each KPI as the lens to choose and to evaluate the success of our improvement projects or change initiatives. We want to always encourage people to keep reaching towards our performance targets. We don’t want to judge success of initiatives by whether they’re on-time or on-budget. Project management is important, but what we want to do is show that our performance overall is improving as a result of the actions that we’re choosing.
PuMP balances the technical and social sides of creating great KPIs.
Finally, PuMP doesn’t just focus on the technical steps of creating great KPIs. It also makes sure we build engagement and buy-in through the entire process because it is ultimately a team process.
In fact, PuMP is at least as much social as it is mathematical. The people that use it have all kinds of emotions about performance measurement, that shouldn’t be ignored or assumed. And this is why PuMP is not done to people. It’s done by people. By being done by people, they buy in and they own and use the great KPIs they create.
Can you describe your KPI approach as a process, like we can with PuMP? If you can’t, then you probably don’t know what you’re doing. [tweet this]
Join Measure Up
Sign up for the Measure Up newsletter and get free access to the "10 Secrets to KPI Success" online course and e-book.

Upcoming KPI Training
>> North America, Online Interactive, 15-19 April 2024
>> Australia/NZ/Asia Pacific, Wellington NZ, 7-9 May 2024
>> Africa, Cape Town SA, 8-10 May 2024
>> UK & Europe, Online Interactive, 10-14 June 2024
>> North America, Online Interactive, 3-7 June 2024


Connect with Stacey
Haven’t found what you’re looking for? Want more information? Fill out the form below and I’ll get in touch with you as soon as possible.
167 Eagle Street,
Brisbane Qld 4000,
Australia
ACN: 129953635
Director: Stacey Barr