How to Find Signals in Your Seasonal KPIs
by Stacey Barr |One of the trickiest KPIs to analyse, interpret and use are those that have a seasonal or cyclical pattern. Can you make these KPIs reveal their insights about how to improve performance, without getting drowned out in the seasonal variation? Yes you can!
Most problem KPIs just need a bit of transformation before they can reveal their insights about changes due to factors other than the ‘change of the season’.
KPIs with seasonal or cyclical patterns…
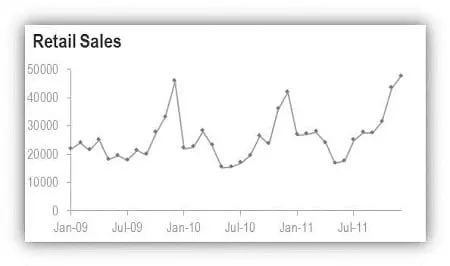
It might be Retail Sales with an annual seasonal pattern driven by consumer behaviour. Or Staff Turnover with a quarterly cyclical pattern driven by employing temporary staff. It might be a daily cycle of traffic congestion.
It’s any performance measure that shows a repeating pattern of variation over consistent timeframes.
Any cyclical or seasonal measure can be “deseasonalised”…
The simplest method I know of to deseasonalise a time series of performance measure values is the method that Donald Wheeler outlines in Chapter 18 of his great book “Making Sense of Data”.
You calculate the average measure value over the period of seasonality, which might be a year. Let’s call that the ‘Seasonal Average’. For example, the monthly average value of Retail Sales over the first year in the time series might be $24,593.
You then calculate ‘Seasonal Relatives’ by dividing your measure values by their corresponding ‘Seasonal Average’. If the Retail Sales for January in the first year was $21,860, then the ‘Seasonal Relative’ for January in that year would be 0.889.
From these ‘Seasonal Relatives’, a ‘Seasonal Factor’ for each month of the year is computed by taking the average of all the Seasonal Relatives for that particular month of the year. Let’s say that over all 3 years in our time series of Retail Sales, the ‘Seasonal Relatives’ for January are 0.889, 0.908 and 0.941 respectively. Their average is 0.912. That’s the ‘Seasonal Factor’ for January in general.
Finally, to remove the seasonal effect from your actual performance measure values, you divide each measure value by the ‘Seasonal Factor’ that corresponds to its month of the year. For January in the first year, it’s deseasonalised value would be $21,860 divided by 0.912 which is $23,959.
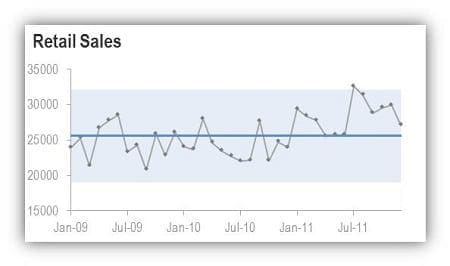
The best way to analyse your deseasonalised KPI…
The best way to then search for real signals of change in your KPI is to construct a Smart Chart for the deseasonalised measure values. (Until November 30, 2012 you can view a free webinar replay introducing what a Smart Chart is.)
TAKE ACTION:
Got a seasonal KPI? Try this method and see if you can reveal any insights that have been hiding in the seasonal variation. Trust me – it’s easy, it’s fun and it’s a very productive use of your time!
Join Measure Up
Sign up for the Measure Up newsletter and get free access to the "10 Secrets to KPI Success" online course and e-book.

Upcoming KPI Training
>> North America, Online Interactive, 15-19 April 2024
>> Australia/NZ/Asia Pacific, Wellington NZ, 7-9 May 2024
>> Africa, Cape Town SA, 8-10 May 2024
>> UK & Europe, Online Interactive, 10-14 June 2024
>> North America, Online Interactive, 3-7 June 2024


Connect with Stacey
Haven’t found what you’re looking for? Want more information? Fill out the form below and I’ll get in touch with you as soon as possible.
167 Eagle Street,
Brisbane Qld 4000,
Australia
ACN: 129953635
Director: Stacey Barr