Strategy Map or Results Map – Which is Better?
by Stacey Barr |Balanced Scorecard Strategy Maps are popular but is a Strategy Map or Results Map better to map and communicate strategy?
[Click the image for a larger view]
Peter Ndaa is our regional PuMP Partner for Africa. With his colleagues at BSEA, Peter has years of deep experience in both Balanced Scorecard and PuMP implementations.

Peter has always seen a clean relationship between the two approaches, using the Balanced Scorecard for strategy design and PuMP for measuring and cascading and executing that strategy. And he has some very clear thoughts about how the Balanced Scorecard Strategy Map and the PuMP Results Map correlate.
How does the correlation between a Results Map and Strategy Map work?
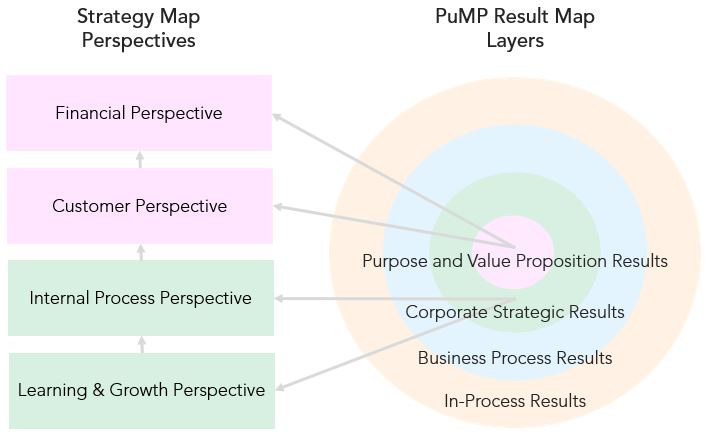
In a Strategy Map, there are four perspectives in its tabular layout:
- Financial Perspective – the results for the shareholders
- Customer Perspective – the results for the customer
- Process Perspective – internal business results
- Learning and Growth Perspective – organisational capability results
In a Results Map, there are four layers in its concentric circular layout:
- Pink Layer – the results for organisational purpose and value proposition
- Green Layer – the results for current corporate strategic goals
- Blue Layer – the results of business processes
- Orange layer – the results of critical sub-processes or activities within business processes
Peter Ndaa elegantly describes the correlation between the Strategy Map perspectives the Results Map layers:
“The Financial perspective reflects desired results for the shareholder. The Customer perspective reflects results for the customer. These are mission and vision results categorised as the pink layer results in a Results Map. The Process perspective and Organisational Capacity (Learning and Growth) perspective results fall under the green layer in a Results Map.”
But where are the Results Map’s blue and orange layers in the Strategy Map?
Peter explains that as a corporate Strategy Map captures outcomes only, it does not include both process and in-process results. To rely on a Strategy Map to communicate strategy organisation-wide, you’ll need both the corporate and cascaded Strategy Maps.
Not being able to see the fully cascaded strategy in a single view has a few risks:
- People get disengaged because they can’t see the clear line of sight from their results or goals, through to the organisation’s ultimate purpose and value proposition, like they can with a Results Map.
- Tenuous or even invalid links can be created from a cascaded Strategy Map to the corporate Strategy Map, but it’s not obvious to see this, like it is in a Results Map.
- It’s difficult to build a story of performance, by following the relationships among the measures of the strategy, which are clear in a Results Map.
So which map works better?
Peter’s opinion is this:
“The Results Map tells a better value creation story as it includes both process results (blue layer) and in-process results (orange layers) which are the real value drivers. It is an enhanced strategy wheel that creates a better picture and understanding of how an organisation is creating unique value for the world.”
Just because a tool like the Strategy Map has been around for long time and used by famous companies, it doesn’t mean it’s still the best way to map, communicate and engage people in strategy execution.
Just because the Strategy Map is famously used, doesn’t mean it’s the best way to map and communicate strategy.
[tweet this]
DISCUSSION:
How have Strategy Maps worked in your organisation? What are your thoughts on their limitations and strengths?
Join Measure Up
Sign up for the Measure Up newsletter and get free access to the "10 Secrets to KPI Success" online course and e-book.

Upcoming KPI Training
>> North America, Online Interactive, 15-19 April 2024
>> Australia/NZ/Asia Pacific, Wellington NZ, 7-9 May 2024
>> Africa, Cape Town SA, 8-10 May 2024
>> UK & Europe, Online Interactive, 10-14 June 2024
>> North America, Online Interactive, 3-7 June 2024


Connect with Stacey
Haven’t found what you’re looking for? Want more information? Fill out the form below and I’ll get in touch with you as soon as possible.
167 Eagle Street,
Brisbane Qld 4000,
Australia
ACN: 129953635
Director: Stacey Barr