The Minimalist Method For Analysing Qualitative Data
by Stacey Barr |We all collect volumes of qualitative data – the data that made up from words and not numbers – as part of doing business. Qualitative data comes from open-ended questions on customer surveys, comment fields on forms, and other blocks of text we capture in our database systems. We collect it, but do we make the best use of it?

You might recall from my article The Minimalist Method For Customer Surveys that I use a very simple four-question feedback form for my PuMP Blueprint Workshop.
The second and third questions ask for qualitative responses, and this data is supremely useful to me in understanding how to continue to evolve the workshop.
Here’s an excerpt of three entries in my feedback database, showing how I collect and categorise the qualitative feedback:

Notice how under each field that captures the responses to the two open-ended questions there are three drop-down fields. These I use to assign up to three categories based on the nature of the comments. I created the list of categories as I went through the first hundred or so feedback forms. And occasionally I add new ones if enough people are mentioning them.
Yes, it’s a bit subjective because I have to interpret what was meant by the words people chose. But it’s still giving me, on the whole, some very insightful themes, even though I surely misinterpret a few of them. Data doesn’t have to be perfectly accurate to be insightful.
The first of these open-ended questions is ‘Why didn’t you rate any higher?’ The answers are a good insight into where participants felt the value fell short for them. I can easily see the strongest themes simply by putting the categories I created into a Pareto chart (this is an excerpt of the feedback from the past 12 months):

When people don’t rate the workshop as 10 out of 10, the main reason seems to be concern about how much control they will have implementing it back at work. Some people’s perceptions about this include:
- “We have things in place so it will be difficult to change.”
- “Not too much influence on defining indicators so some steps are hard to use.”
- “I found it very valuable, I just need to work out how to influence management to work with me on this.”
This topic of helping people on the implementation side of PuMP is inspiring the creation of a couple of new products, one about guiding people to their first ‘PuMP Quick Win’, and the other about how to win the buy-in and support from colleagues to get involved in measuring performance.
As an aside, notice how the second longest bar in the above chart is ‘Other’. Given that there are so many ‘other’ reasons, it’s worth looking at these feedback records a second time over, to see if they any can be meaningfully allocated to an existing category, or if there are enough to warrant creating a new category or two.
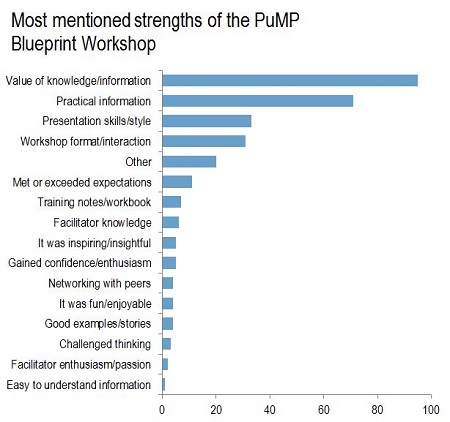
The second open-ended question was ‘Why didn’t you rate any lower?’ Categorising and analysing this data helps me find out what participants most valued about the workshop. (Again, this is an excerpt of the feedback from the past 12 months.)

How the value of the information and the practicality of the information both top the list of reasons why people rated the workshop as high as they did. They said things like:
- “Directly addressed my needs; understandable, relevant & comprehensive. Time allocated to discuss, practice etc was excellent.”
- “As a new person to PM every little bit of information was helpful & useful. Thanks.”
- “Excellent content and I liked that at the end of the course there is a defined process to follow.”
This information helps me decide what features of the workshop to promote to prospective attendees. It also makes sure that I protect these strengths in the workshop.
So analysing qualitative data isn’t hard. Yes, it does take some time to do the categorising. And you do need to have a purpose for using it. But really, if you’re not going to take the time to use the data, why are you collecting it?
TAKE ACTION:
Do you have performance improvement questions that could use some qualitative data to answer? Do you have this qualitative data? What are you going to do with it now?
Connect with Stacey
Haven’t found what you’re looking for? Want more information? Fill out the form below and I’ll get in touch with you as soon as possible.
167 Eagle Street,
Brisbane Qld 4000,
Australia
ACN: 129953635
Director: Stacey Barr


