Interpreting Signals in my New Website Visits KPI
October 20, 2020 by Stacey Barr | Leave a Comment
This case study demonstrates how to interpret signals in trending KPIs, like my New Website Visits. (more…)
This case study demonstrates how to interpret signals in trending KPIs, like my New Website Visits. (more…)

There is a lot of doubt about how to correctly set a performance measure's baseline using XmR charts. Remove your doubt by following this process. (more…)
Filed Under: Interpreting Performance Results
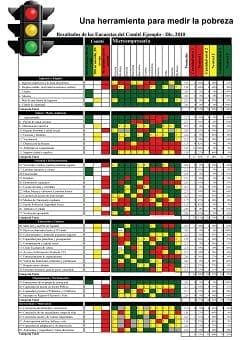
How to create a KPI traffic light dashboard or traffic light report to highlight signals in a clear, valid and constructive way, and avoid the 3 big problems. (more…)
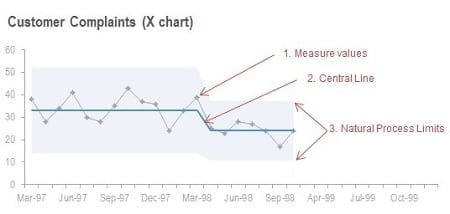
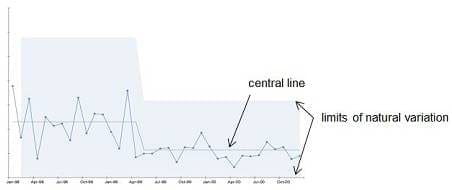
Do you have these 3 essential things on your KPI graphs in your dashboard? If not, you're misinterpreting your performance measure signals. (more…)

There is a statistically proven sweet spot for how many KPI data points you need before you can start using them and accurately interpreting signals from them.
Filed Under:
Analytics and Data Analysis, Interpreting Performance Results
They're so hot right now, sparklines. They thankfully bring some sanity to performance dashboards (goodbye goofy gauges). But they do have a limitation no-one seems to be talking about. (more…)
Filed Under: Performance Reporting and Dashboards
Sign up for the Measure Up newsletter and get free access to the "10 Secrets to KPI Success" online course and e-book.

>> Australia/NZ/Asia Pacific, Wellington NZ, 7-9 May 2024
>> Africa, Cape Town SA, 8-10 May 2024
>> UK & Europe, Online Interactive, 10-14 June 2024
>> North America, Online Interactive, 3-7 June 2024
>> USA, Washington DC, 25-27 June 2024

Haven’t found what you’re looking for? Want more information? Fill out the form below and I’ll get in touch with you as soon as possible.

