How to Handle Missing Data in Your KPIs
by Stacey Barr |Missing data for your KPIs could mean you’re missing important signals. Here are 3 ways to handle missing data.

Those gaps we see in our KPI charts can be troublesome. If missing values happen often enough, we could miss important signals about performance. And depending on why the missing values happen, it could be that the rest of the data might not be trustworthy enough.
There are three main types of missing data situations that arise with our KPIs or performance measures, and we’ll explore each one:
- Events don’t happen frequently enough.
- Data was missed unintentionally.
- Data collection isn’t a formal routine.
Working out which of these situations is at play in our measure is very important, because it will affect how we deal with it. I’ll be using a couple of examples kindly provided by one of our PuMP Community members, Bill Wiest, for illustration.
Missing Data Situation 1: Events don’t happen frequently enough
It might feel right to measure something monthly, because you measure most things monthly. But some results that we’re measuring simply don’t happen or change that frequently. And it leaves lots of missing values in our monthly graph, like in one of Bill’s measures:
“In the shipment lead time for one of our product lines, we had months, sometimes several in a row, in which there is no data. This is due to the fact, that, for this particular product line, orders tend to be large, but infrequent. I am tempted to remove the months which have no data, since my sense is, these are like anomalies that are not really part of the process we want to measure.”
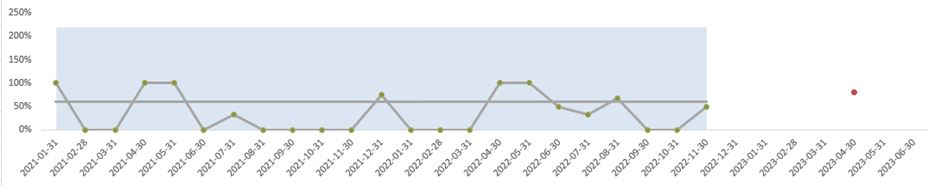
Bill is right in this case. Those zero values we see in the chart above suggest that none of the orders shipped were within lead time. Some of those zeros might be legitimate, and the zero value needs to stay. But sometimes it might be because there were no orders to ship, and leaving them out altogether, instead of making them zero, is the way to go.
However, imagine we’re measuring the counts of orders delivered each month. Then it’s true that this kind of missing value is a real zero. There were legitimately no orders to deliver in those months. So leaving the zeros in the graph, in that case, is the right choice.
Either way, when we have infrequent events, then it’s more important to reconsider the appropriate calculation cadence for our measure. Monthly doesn’t make sense for everything.
Missing Data Situation 2: Data collection isn’t a formal routine
When there isn’t a formal data collection process, missing values are inevitable, and often rather frequent. And another example from Bill suggests another of his measures has this problem:
“On occasion, we have a situation in which there is no data for a given period, so the measure value goes to zero for that period. We had this happen, for example, recently, when our Production Controls Coordinator was away for a week. None of his colleagues stepped in to take over for him while he was gone, so there was no measure value for that week! When he returned, we discussed this and decided to remove that week from the chart. At the time, I thought ‘Hmmm, is that valid?’ In the end, it seemed to make sense since, it could affect the performance average, well, unfairly.”
Again, Bill is right. Replacing missing values with zeros is not the solution for every situation. In this situation, it wasn’t that performance was zero for that week. In fact, we have no idea what performance was at all. So these missing values should be removed from the measure’s chart.
The bigger problem is that the data is missing, but shouldn’t be. We need to engage the teams responsible for the data in a way that helps them have ownership for the measure, so there is purpose for them working out a system to be sure the data is captured all the time. It means that rather than rest the responsibility of data collection on just one or two individuals, we need to have formally designed and documented and resourced data collection routines.
Missing Data Situation 3: Data was missed unintentionally
It happens to all of us. Some random event interrupts our data collection, or destroys the data we did collect. It might be a power failure, a computer crash, or a workplace emergency. And we end up with a missing value in our KPI graph.
The consequence of this is fairly minimal. If we’re using XmR charts, our attention is on the patterns over time, on the central line and natural process limits. Our attention is not on any one individual measure value. So a single missing value is treated how we treat any outlier in XmR charts.
What’s important in this type of missing data situation is that we find out the reason for the missing value, and then leave it blank in our KPI graph. We might choose to add a footnote about its cause, but trust that it won’t affect our interpretation of performance.
***
When our KPIs or performance measures have missing data, it’s not always a problem. We just need to understand why the data is missing. Then we take the right approach to communicate this in our KPI charts and, if possible, prevent more missing data in the future.
Join Measure Up
Sign up for the Measure Up newsletter and get free access to the "10 Secrets to KPI Success" online course and e-book.

Upcoming KPI Training
All our PuMP training options have moved to PuMP Academy.


Connect with Stacey
Haven’t found what you’re looking for? Want more information? Fill out the form below and I’ll get in touch with you as soon as possible.
167 Eagle Street,
Brisbane Qld 4000,
Australia
ACN: 129953635
Director: Stacey Barr