KPIs Are Interdependent With Each Other
by Stacey BarrReviewing KPIs, one after the other, won’t lead to lasting performance improvements. KPIs are interdependent, and should be reviewed collectively.

If you’ve not heard the expression before, a tick-and-flick approach to KPIs means that we just look at one measure, assess its performance, make a decision, then move on to the next measure.
It’s a linear approach to navigating organisational performance, with blinkers on. And it leads to a situation Martin Lindstrom describes so succinctly, where:
“Every little KPI becomes their own little ecosystem… they want to survive…” — Why KPI’s Are Killing Today’s Organizations [at 2:00]
And each little KPI ecosystem creates its own set of behaviours, excuses and quick fixes to hit targets that were set in isolation of every other KPI. The performance of the whole organisation declines because of this, because the whole is not the sum of the individual KPI ecosystems.
The secret to improved organisational performance is the relationships between and among KPIs, not the individual KPIs themselves.
KPIs are interdependent, not independent.
How one KPI changes will change other KPIs. Sometimes the change is a good flow-on effect. Other times it’s a sabotaging unintended consequence.
To find the lovely, magical balance between and among our KPIs, to optimise the whole organisation’s performance, KPIs must be treated as interdependent. We must use them collectively, not tick-and-flick our way through them.
We need to do three things to use our KPIs collectively:
- Get the full picture of the KPI interdependencies.
- Set the right aperture of focus on smaller collections of KPIs.
- Pan over the smaller KPI collections.
1. Get the full picture of KPI interdependencies.
In PuMP, we use a Results Map to build the story of the organisation’s strategy. It includes all the goals (written as performance results) that matter, how they relate to the logical layers in the organisation, and how they relate to one another.
Then, when the KPIs are attached to each result in the Results Map, we also have a map of the interdependencies between and among our KPIs. We have a single, full picture.
For example, this is an excerpt of a Results Map, for an investment data room provider, to give you the idea:
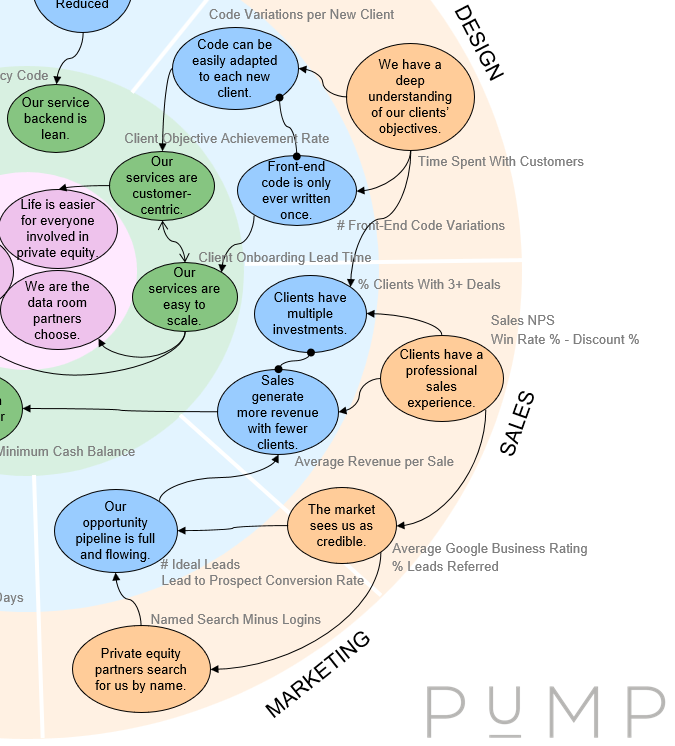
[click to see a larger version]
Of course, no one person – indeed, no one team, even – can process every KPI in an organisation simultaneously. So we need to make a compromise.
2. Set the right aperture of focus on smaller collections of KPIs.
Results Maps become quite complex, especially for larger organisations. We avoid the overwhelm by zooming in, but not too far. That’s the compromise: we focus on a smaller collection of KPIs. In the Results Map, we narrow the aperture to focus on just one slice.
A slice usually belongs to a natural team in the organisation, and their performance report or dashboard would focus on the set of KPIs that lived in their slice of the Results Map.
In the investment data room example, Design is one slice of the Results Map:
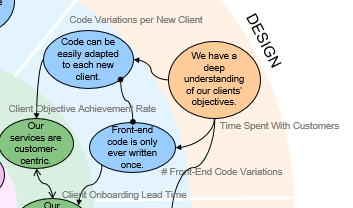
[click to see a larger version]
Within a slice, the number of KPIs there is small enough to process collectively, in a single performance report or dashboard. But we don’t want Design, or any other slice, to become just another ecosystem, like we’re trying to avoid with our KPIs.
And we can avoid that, by continuing to use our map of KPI
interdependencies, beyond the boundaries of each slice.
3. Pan over the smaller KPI collections.
In a Results Map, the KPIs don’t know boundaries. Their interdependent relationships extend over the entire map, no matter where we place slices (or create silos, which is the same thing). So, while we need to use slices to focus on a
manageable number of KPIs, we need to look between the slices for other important interdependencies that flow across them.
In the investment data room Results Map, the Sales slice and the Marketing slice clearly have KPI interdependencies that flow between them:
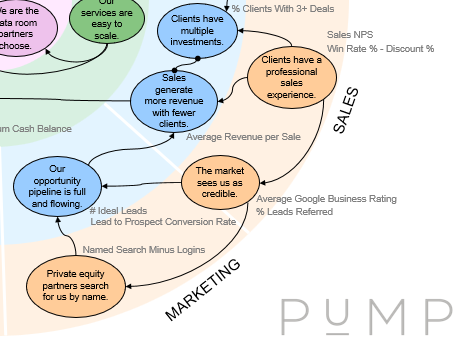
[click to see a larger version]
And this is the trigger for how the Sales team and Marketing team need to collaborate in this company. They don’t focus just on their own slice’s KPI collection. They also get together to focus on the KPIs they each have, which share a relationship. And each team will have reason to collaborate with other teams, that have their own slices, too. Collaboration, therefore, becomes more purposeful and directed toward optimising organisational performance.
The secret to improved organisational performance is the relationships between and among KPIs, not the individual KPIs themselves. [tweet this]
Join Measure Up
Sign up for the Measure Up newsletter and get free access to the "10 Secrets to KPI Success" online course and e-book.

Upcoming KPI Training
All our PuMP training options have moved to PuMP Academy.


Connect with Stacey
Haven’t found what you’re looking for? Want more information? Fill out the form below and I’ll get in touch with you as soon as possible.
167 Eagle Street,
Brisbane Qld 4000,
Australia
ACN: 129953635
Director: Stacey Barr