How To Tell An Insightful Story Of Performance With Measures
by Stacey Barr |Performance measures aren’t doing their best work when you treat them as a tick-and-flick monitoring tool. They are only giving you one angle on performance. Often the insights you need will come from a richer story that needs more characters to give a fuller picture.
The cast of characters in a story about performance are similar to the characters of any story:
- The Protagonist: This is the main character, whose problem forms the central theme of the story. The performance measure we want to improve most of all is our protagonist.
- The Antagonist: This is the character who plays in opposition to our protagonist, who poses the obstacles which much be overcome to solve our protagonist’s problem. Measures of the causes that are constraining our performance measure are our antagonists.
- The Anti-hero: This is the character who may currently lack the wisdom or values required to achieve the goals they have. We are the anti-heroes of stories about performance! We must often overcome our biases or knowledge gaps to find the insights to achieve our goals. And this quest is usually a battle with the root causes that hold performance back from targets or expectations.
Meet Julia’s protagonist…
Julia works with a children’s social care service in the UK. Her team receives case referrals relating to child care. Case referrals are triaged by the team and then those with greater priority are assessed more formally in what is called an Initial Assessment.
Initial Assessments determine the extent and degree of risk to the child, and therefore what action Julia’s team is going to take. So a very important performance measure that the team tracks is % Initial Assessments Completed in 10 Days. The following XmR chart shows this measure’s performance since April 2011:
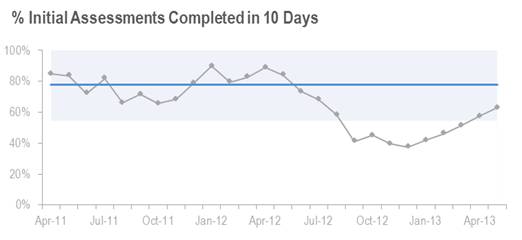
From as early as October 2012, the point where the second value of the measure falls below the bottom natural process limit (part of a short run signal), we can be certain that far fewer Initial Assessments are being completed within 10 days. In fact, the overall level of completion reduced from 77.7% to 44.3%.
This drop could have started as early as May 2012, where we can see the start of a steady decline. But it took its effect on performance somewhere around August 2012, when the short run signal showed up:

What caused the large drop? And what is happening over the last six months in the series? Is it evidence of a push to return to the previous levels? Or was some fundamental cause identified, and carefully addressed?
Meet Julia’s antagonists…
Can an increased workload explain the drop in performance? Not necessarily, according to the following measure of Number of Case Referrals:

Do you see the small upward shift, from an overall level of 264 to 282, which happened from March 2012? Was an extra 18 cases a month a big enough increase that the demand became more than Julia’s team’s capacity?
Another potential reason why % Initial Assessments Completed in 10 Days might have dropped is if a higher proportion of the case referrals were flagged as needing an initial assessment.
But the XmR chart for % Case Referrals Requiring Initial Assessment shows no signal of change over time. There is only a ‘special cause’ or outlier in December 2012. Usually outliers like this are very rare and have a very specific once-off cause or explanation.

We know that the Number of Case Referrals increased a little, and so did the number of those that required initial assessments. In fact, around May 2012 the overall level increased from 151 per month to 166, only slightly lagging behind the increase in case referrals:

Were the team already working to capacity, such that a small increase could throw them into chaos, and cause such a disproportionately large decline in % Initial Assessments Completed in 10 Days?
Or was something more going on, perhaps with the complexity of those cases, or a reduction in the size of Julia’s team?
The quest of our anti-hero, Julia…
Asking all these questions is exactly how a performance story can become insightful. And the quest to answer these questions is the quest of our anti-hero, Julia.
The first thing that Julia did when she saw these graphs of her measures was draw on her experience to find reasons for the signals. She recalled an inspection by regulators in July of 2012 and how her team had spent some time before that inspection trying to improve timeliness.
Performance improvement recommendations from the inspection were published in August 2012 and they began acting on those recommendations, and kept striving to improve timeliness. This might be the reason for the increase in Number of Completed Initial Assessments.
But since then, Julia’s team had a lot of staff turnover, working against their efforts to get a measurable increase in % Initial Assessments Completed in 10 Days.
They were conscious of performance slipping and a backlog building, so they had extra staff working to carry out assessments during December 2012 and January 2013. This may be the reason for the start of a steady increase we see in % Initial Assessments Completed in 10 Days since December 2012.
How will Julia’s story end?
Extra staff is a Band-Aid solution, a way of ‘stopping the bleeding’ but certainly not a way to prevent more wounds. Julia and the team will need to take a closer look at the design of their Initial Assessment process, and find a way to make it fundamentally faster, without the need for more staff and harder work.
And because we can all identify with out anti-hero, Julia, we know how we want this story to end!
TAKE ACTION:
Do you have a performance measure whose refusal to reach a target has perplexed you? Gather your thoughts, gather some extra information, and put together a story of what’s happening and why. You might find an insight that has been eluding you, and might just be the leverage to pursue that target!
Join Measure Up
Sign up for the Measure Up newsletter and get free access to the "10 Secrets to KPI Success" online course and e-book.

Upcoming KPI Training
All our PuMP training options have moved to PuMP Academy.


Connect with Stacey
Haven’t found what you’re looking for? Want more information? Fill out the form below and I’ll get in touch with you as soon as possible.
167 Eagle Street,
Brisbane Qld 4000,
Australia
ACN: 129953635
Director: Stacey Barr