3 Essential Signals to Look for in Your KPIs
by Stacey Barr |You won’t find true signals of changes in performance by looking at month-to-month comparisons, or trendlines, or moving averages. The signals you really need to know about, the only signals that you ought to respond to, are revealed through one particular graph only.
The typical analysis methods we use for our performance measures are based on assumptions that don’t make much sense:
- Month-to-month comparisons assume that there is no routine variation over time and wrongly interpret any difference as a signal.
- Trendlines assume that all change is linear and gradual, and that if Excel can calculate a trend line then there must be a trend.
- Moving averages assume that seasonal patterns exist, and also that change is smooth and gradual.
The only analysis technique I have ever come across that clearly filters the noise and highlights the signals in our performance measures is the XmR chart.
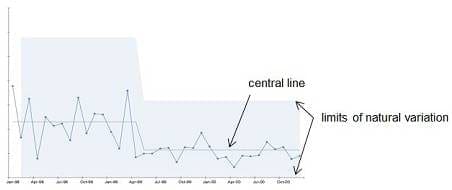
The XmR chart filters the noisy routine variation in our measures by showing us how much of this routine variation there is, by way of the Natural Process Limits. And coupled with the Central Line, these Natural Process Limits give us a meaningful baseline to quickly assess when performance has changed; when there is something else going on that’s not part of the routine variation.
XmR charts are not that hard to create, but offer us absolute gold for KPI interpretation.
There are three very specific signals to look for.
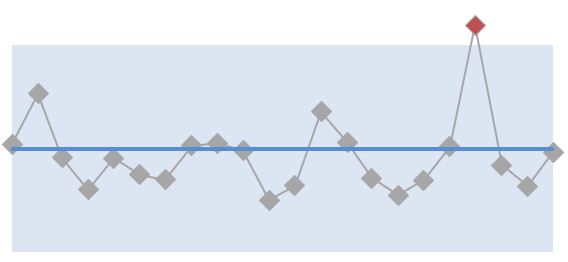
SIGNAL 1: Outlier or special cause
When a measure value falls outside the Natural Process Limits, it means that more than just the routine variation is at play. It’s a signal that something unusual, but temporary, has happened.
If Employee Attendance plummeted below the bottom Natural Process Limit, a likely cause could be a flu epidemic or local natural disaster that kept many more people away from work in that period.
Even though this is a signal that something out of the norm has happened, because it’s just a one-time event, we don’t react to it. We find out what caused it, but we don’t run around madly trying to fix it. That would be a massive waste of time and money because we’d essentially by trying to fix something that won’t happen again, or that is completely outside our control.
SIGNAL 2: Long run
To be convinced that a change in the level of performance has happened, we need to see eight (yes, eight) points in a row on the same side of the Central Line. The probability that a pattern like that is part of routine variation is close to zero (0.39%, to be precise). Eight points, not three or five or one.

If a measure of Invoice Errors showed a long run below the Central Line, it might be evidence that an initiative to simplify the pricing strategy had successfully reduced the errors in invoices.
When we see a long run signal in our measure, we certainly need to find the cause for it. Sometimes it will be a signal of improvement, and we want to confirm what caused the improvement. Other times it will be a signal that performance has deteriorated and the cause of that is very important to identify!
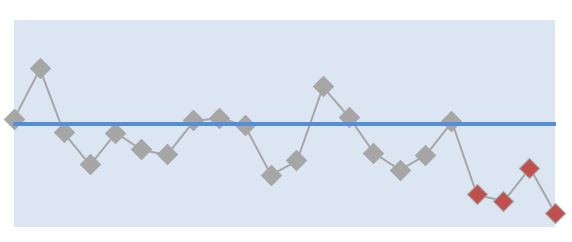
SIGNAL 3: Short run
You’re no doubt thinking to yourself ‘I can’t wait for seven months before I can know if I should take action!’ You can either measure more frequently to pick up signals sooner (as long as it makes sense to), or plan for bigger signals.
A bigger signal appears as a short run, with three, or three out of four, consecutive measure values closer to a Natural Process Limit than they are to the Central Line. The probability of this pattern happening also has a very close to zero probability.
A short run below the Central Line for Delivery Cycle Time for a trucking company would likely be due to an initiative that had a substantially large impact. It could be something like doubling the fleet size. But it also could be a new competitor in the market that poached a large percentage of their customers.
Again, with a signal like the short run, it’s really important to find the cause before responding.
XmR charts take only a little effort to learn, but their usefulness is so powerful they are absolutely worth trying.
TAKE ACTION:
Choose just one of your current KPIs or performance measures, collect at least 5 measure values, but ideally about 20 or more, and create an XmR chart for it. What signals do you see? Is this the first time you’ve seen them?
Join Measure Up
Sign up for the Measure Up newsletter and get free access to the "10 Secrets to KPI Success" online course and e-book.

Upcoming KPI Training
All our PuMP training options have moved to PuMP Academy.


Connect with Stacey
Haven’t found what you’re looking for? Want more information? Fill out the form below and I’ll get in touch with you as soon as possible.
167 Eagle Street,
Brisbane Qld 4000,
Australia
ACN: 129953635
Director: Stacey Barr