Interpreting Signals in my New Website Visits KPI
by Stacey BarrThis case study demonstrates how to interpret signals in trending KPIs, like my New Website Visits.

When our KPI has an underlying trend, and we want to detect signals of change, we use a trending XmR chart. My New Website Visitors measure is such a KPI. It clearly has some trending, for the most part anyway:
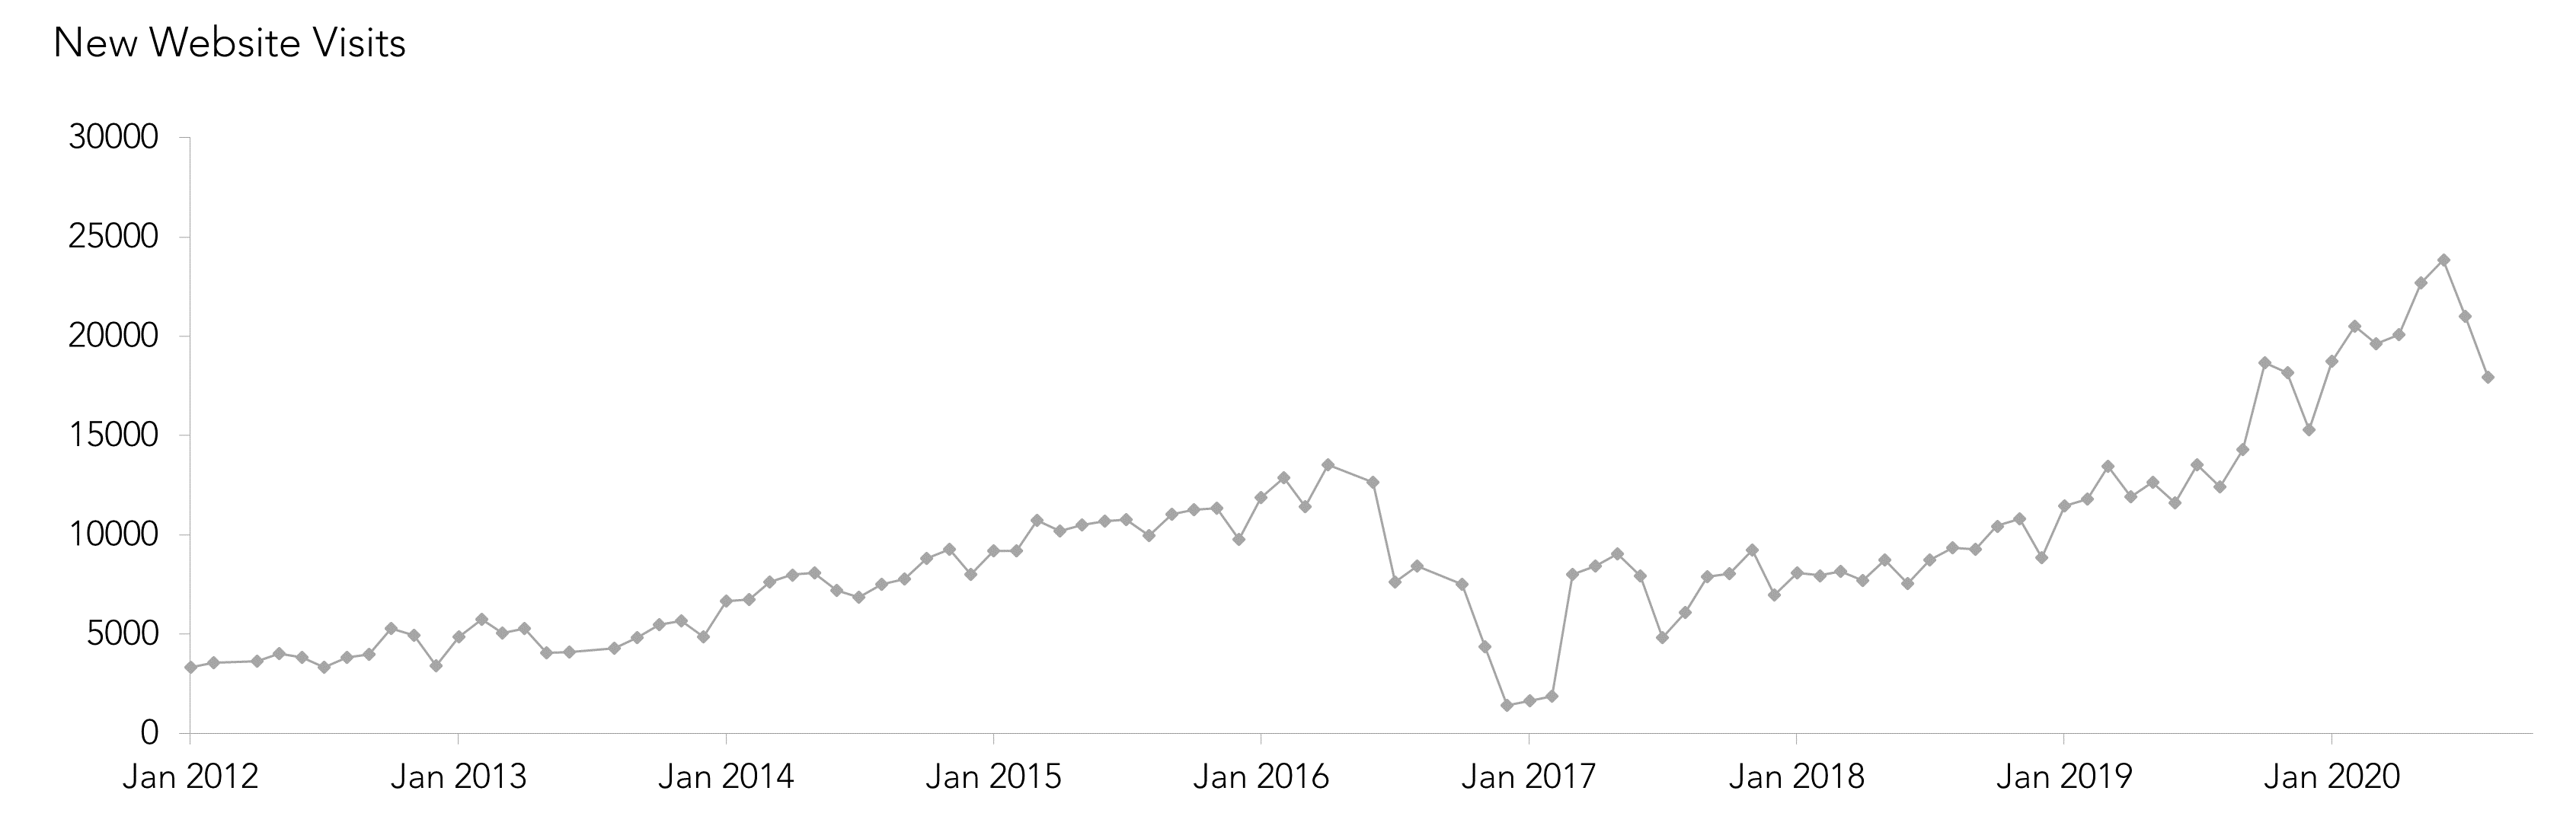
You can probably also see an obvious change in the measure, and you probably cannot see a couple of other signals (which I already know are there).
Let me reveal – and explain – those signals to you, using a trending XmR chart. [In truth, I’m going to keep this simple by just showing the X part of the XmR chart, but you can download a spreadsheet template that includes
mR charts, from this earlier post about interpreting signals from trending KPIs.]
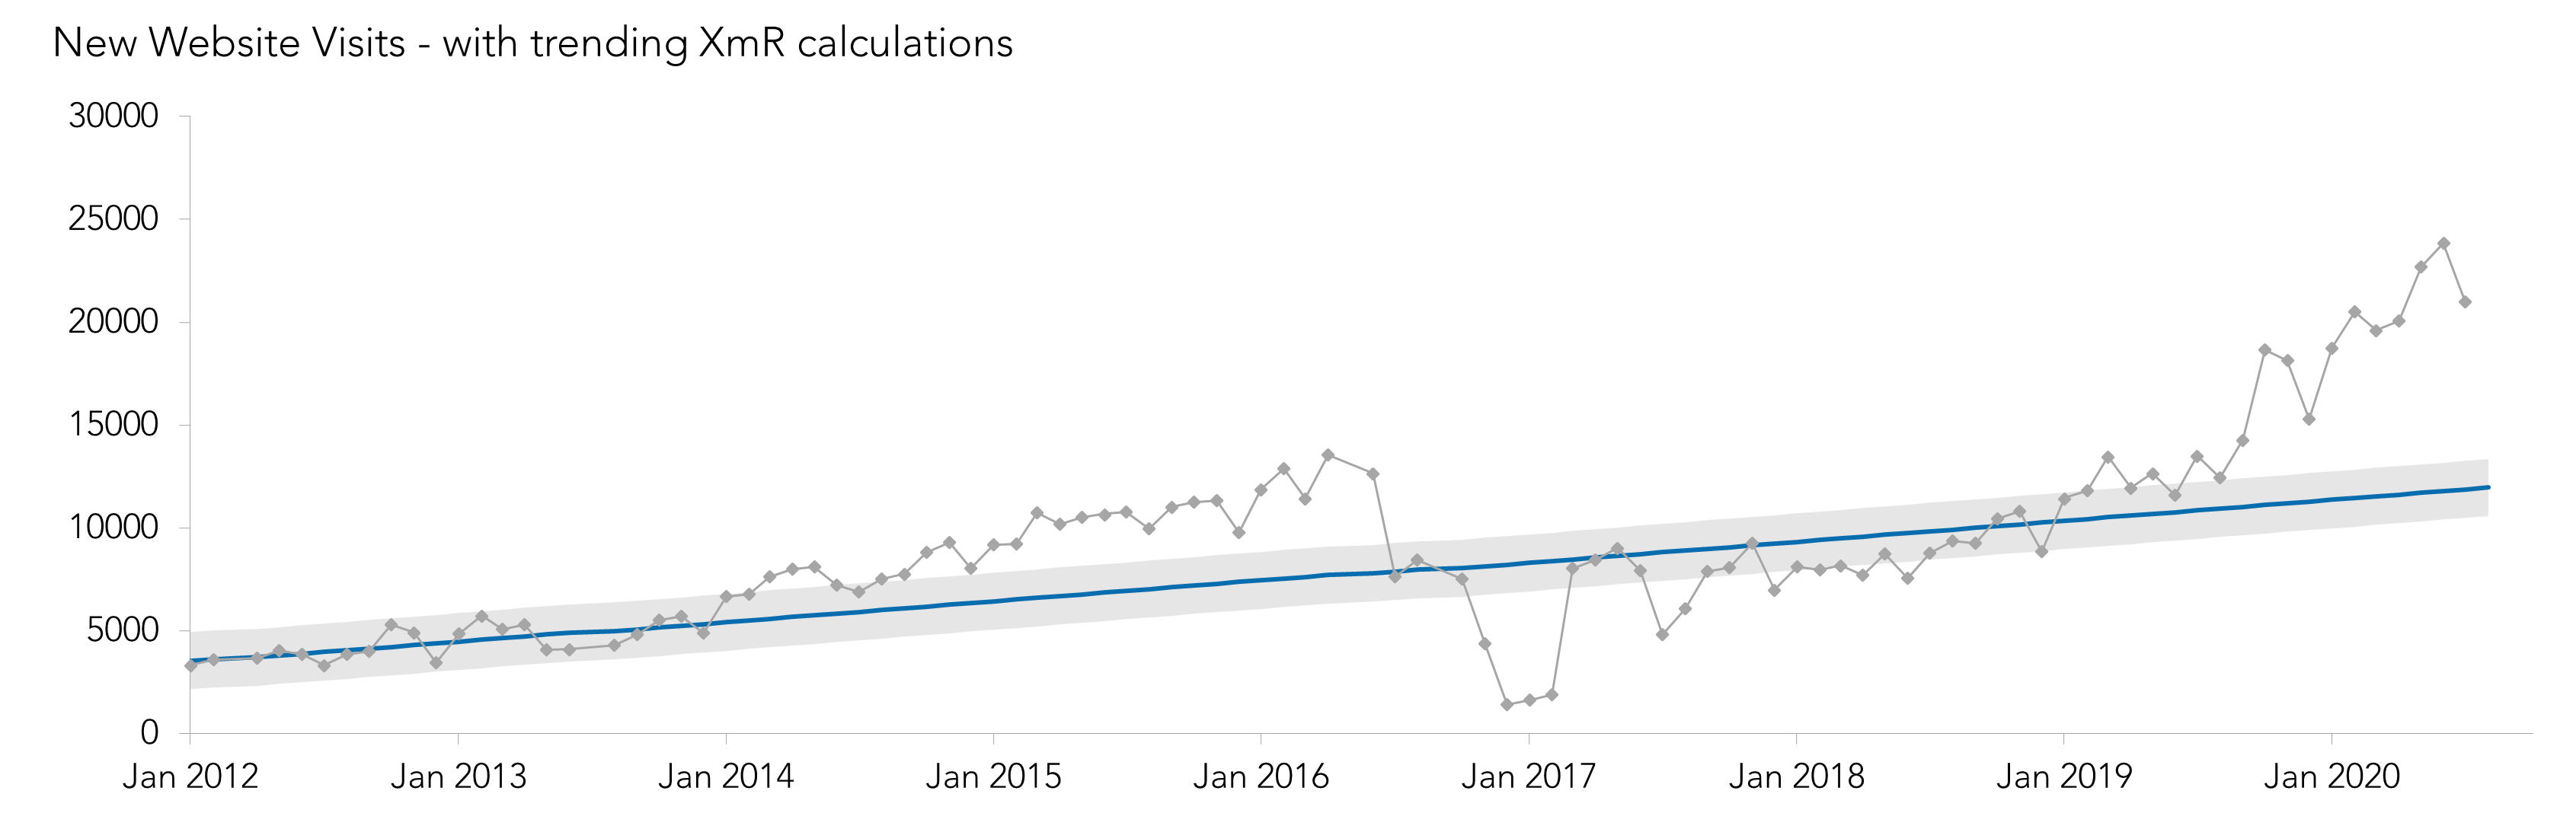
Establishing the trending XmR chart for New Website Visits
Right away, the trending XmR chart shows that growth rate of New Website Visits changed around January 2014. The Central Line (performance baseline) and Natural Process Limits (natural variability) clearly don’t explain patterns in this measure after January 2014.
The first signal of change in New Website Visits
This first signal of change is based on one of the essential signals we look for in XmR charts – the short run signal. To my reckoning – because it was a change that I didn’t deliberately try to make – it’s because I began licensing PuMP to other consultants around that time, and their networks began visiting my website.
Irrespective of the cause, the New Website Visits trending XmR chart requires a recalculation of the performance baseline and natural variability, from January 2014 onwards. And then looks like this:
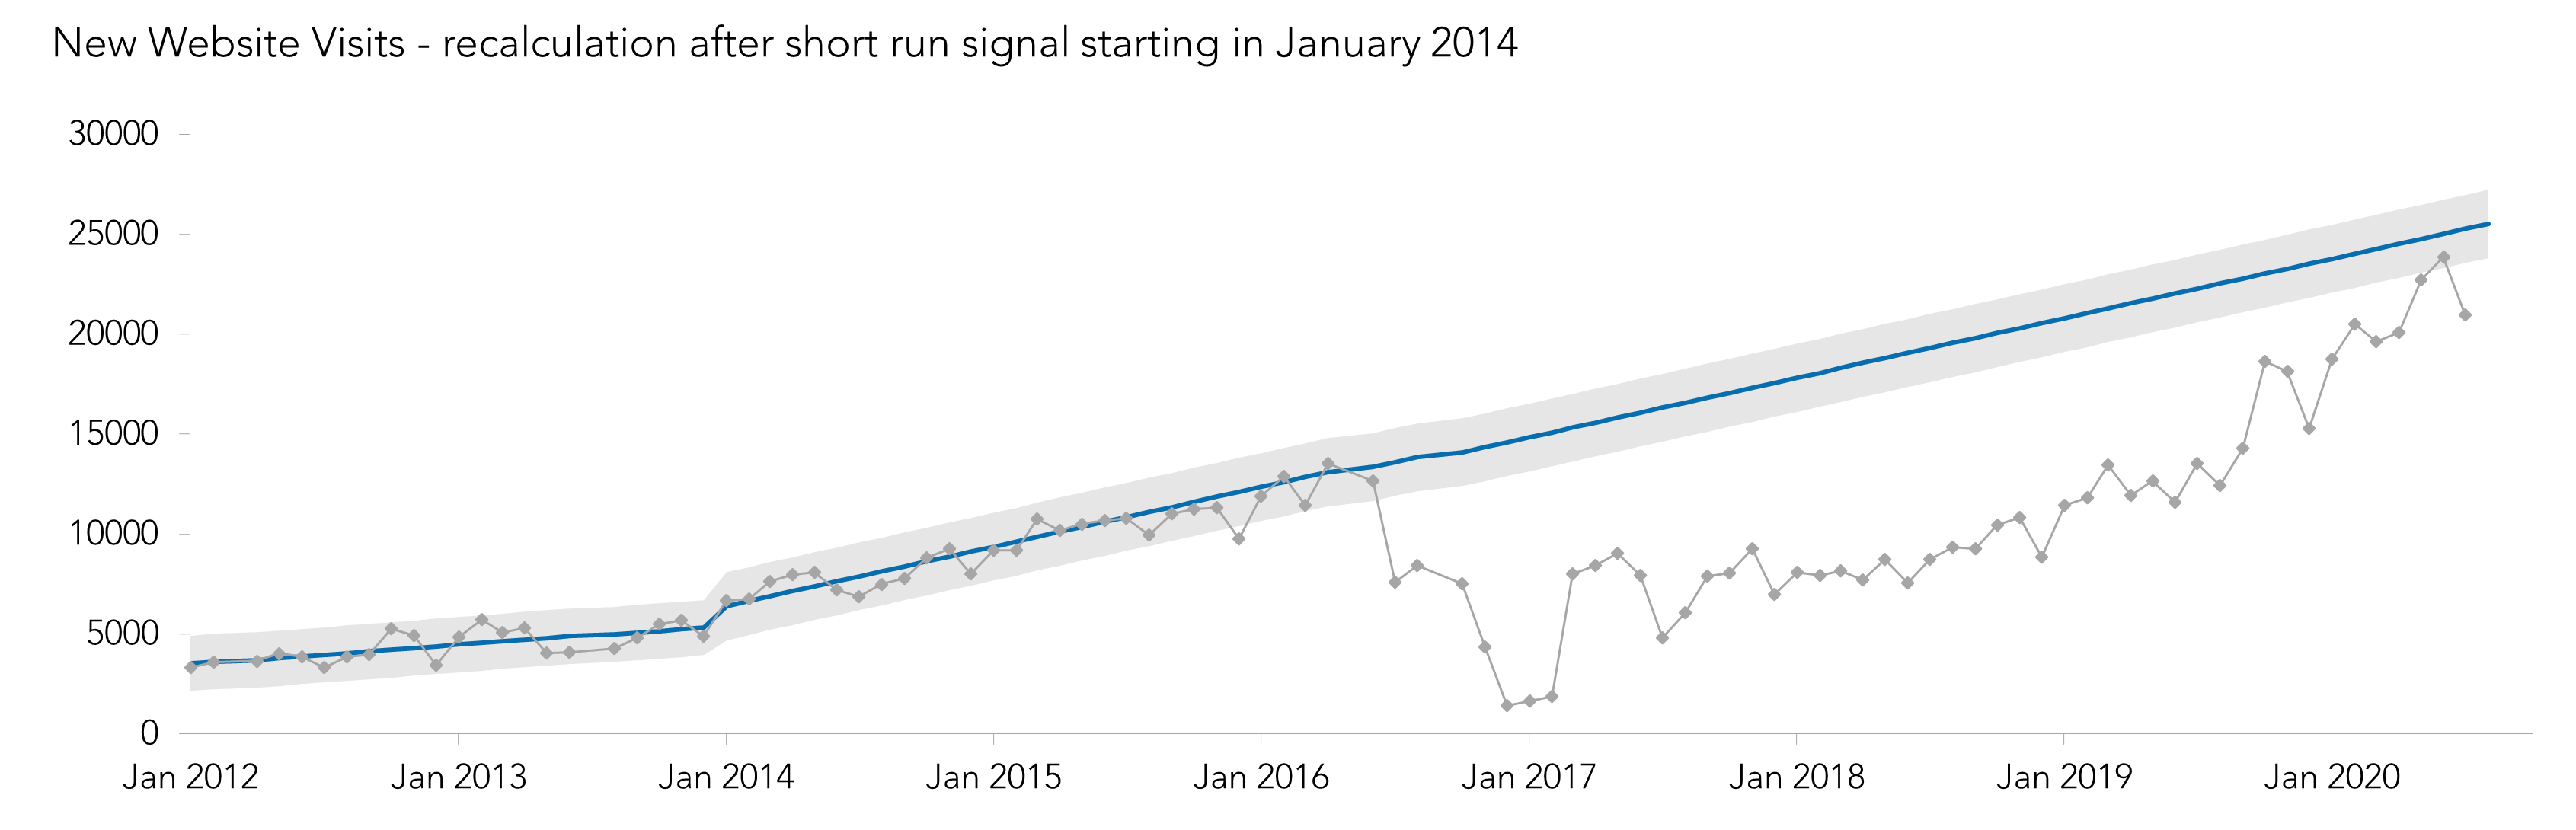
Now we can look for the next signal. And I’m sure it’s obvious to you.
The second signal of change in New Website Visits
We don’t need any signal rules to be convinced of the big dip that began in July 2016. Can you imagine how shocked I was to see that, and to see it get dramatically and inexplicably worse over the next few months?
After a lot of investigating and hiring some professional help, we learned that Google had ‘penguined’ my website. What that means is that Google stopped ranking my website completely, because it found that a lot of the links to my site were coming from dodgy and illegitimate websites. Google thought I was ‘spamdexing’, trying to manipulate search engine indexes to rank higher.
In case you’re wondering, no, I didn’t do that spamdexing! I didn’t even know it was a thing. What happened was a negative SEO (search engine optimisation) attack. Someone who didn’t want my website ranking well (and it was ranking very well for most KPI-related terms) set up those dodgy links. They succeeded, and I had no choice but to start again.
Starting again after the New Website Visits chaos
You’ve no doubt also noticed, in the last chart above, that I didn’t bother recalculating the performance baseline and natural variation over the ‘negative SEO attack’ period. No point. When chaos strikes a KPI, we need to stabilise it and then start afresh with a new performance baseline.
One of the strategies I used to stabilise my Google rankings was using Google’s disavow tool. For the hundreds of dodgy links the attacker set up, I had to disavow them all. [The attack continues, by the way, so disavowing new dodgy links has become a routine for my team.]
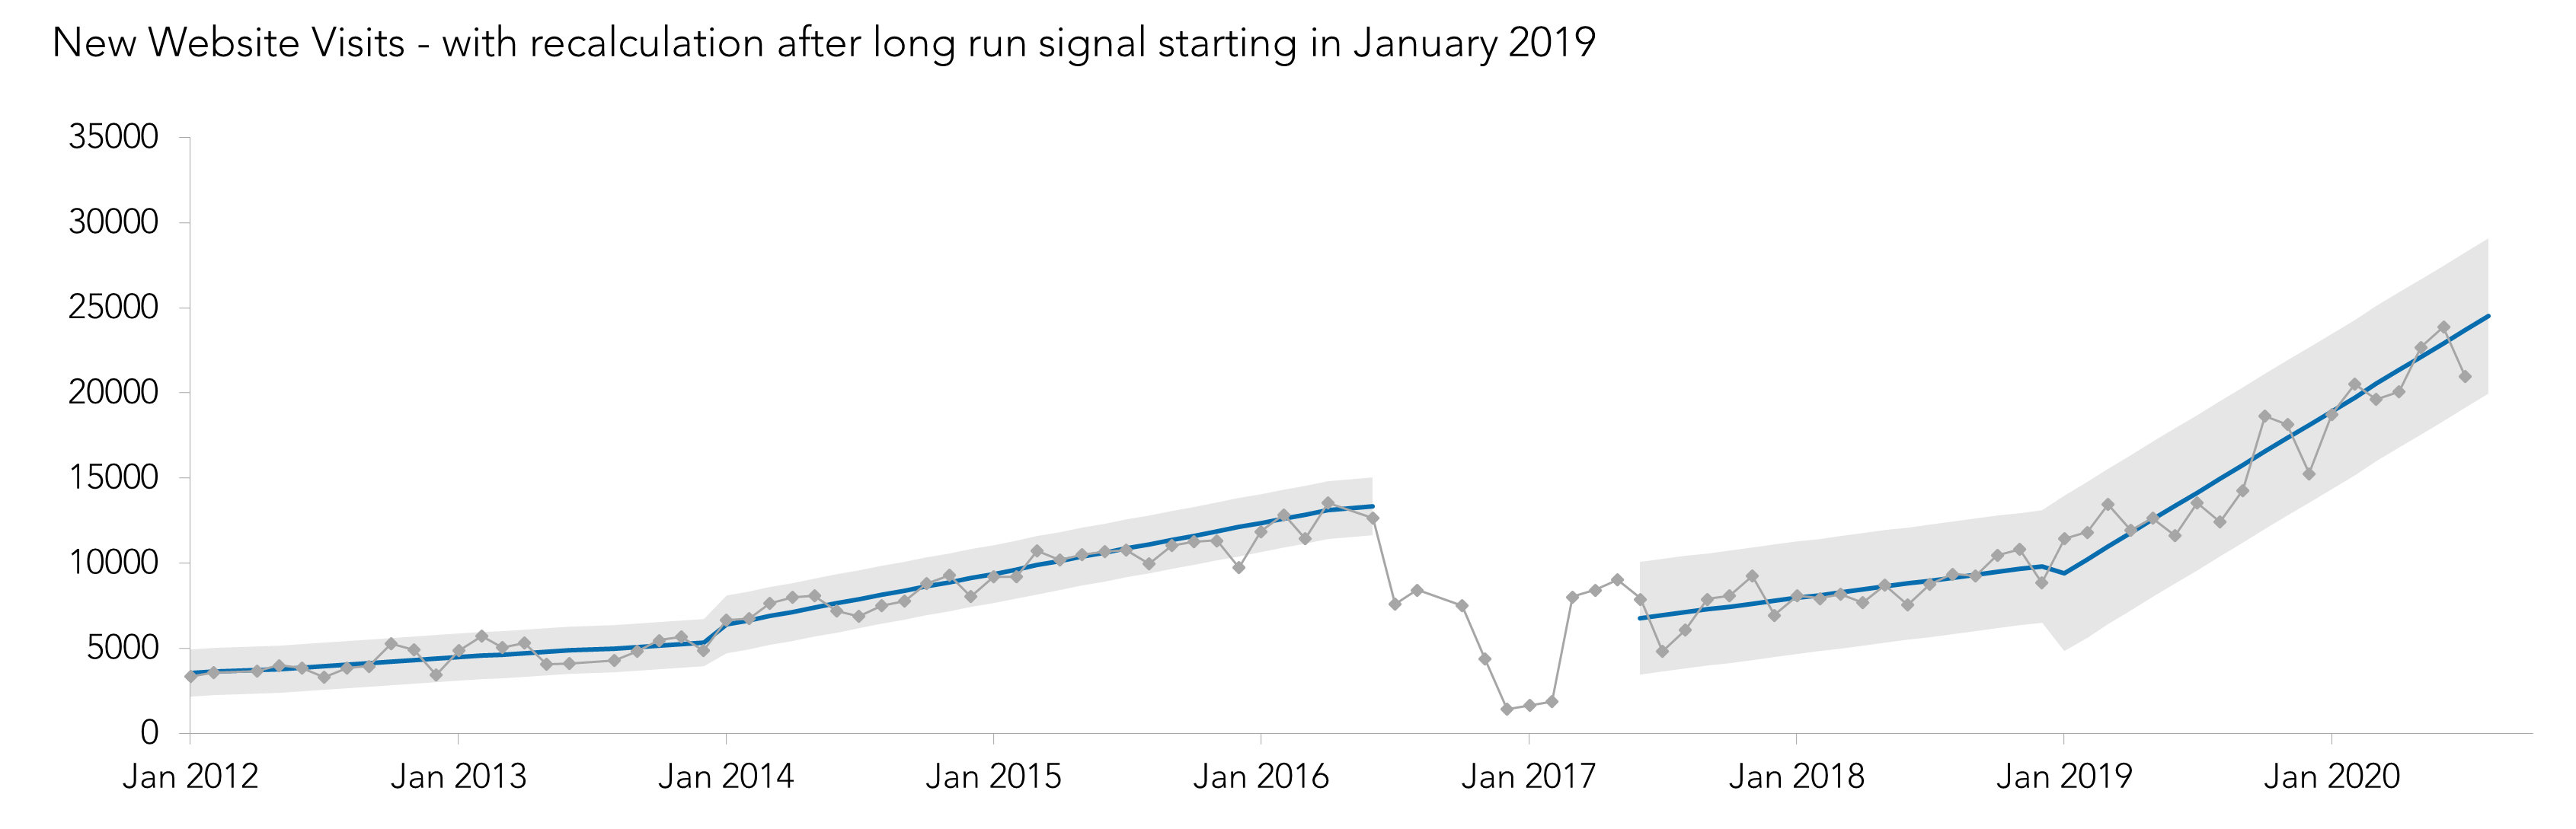
The rankings began growing again and a new trend stabilised, from around July 2017. So, New Website Visits got a new performance baseline:
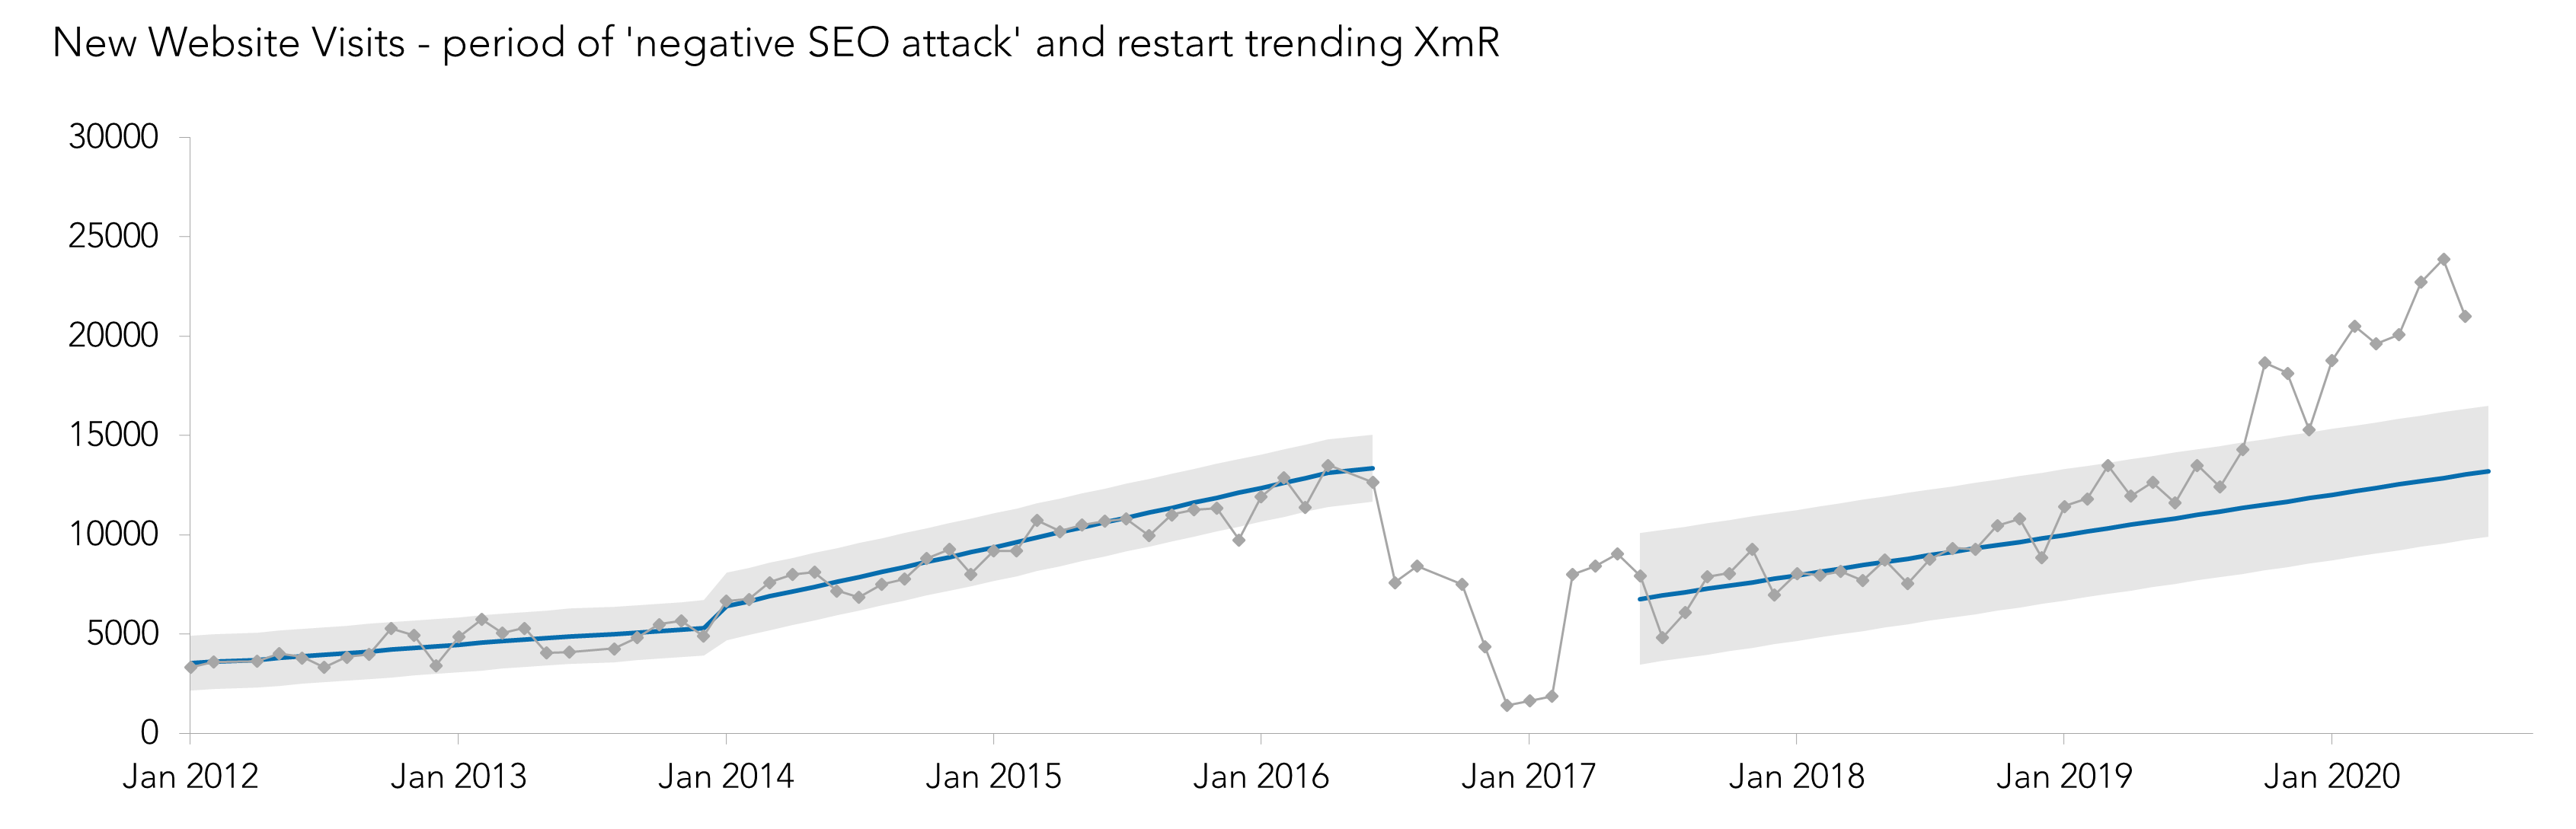
A now we can see a new signal, a long run starting from January 2019.
The third signal of change in New Website Visits
Not long before January 2019, I began learning more about search engine optimisation (the right way, of course). And I redesigned by website publishing process, in these ways, to improve the quality of its content:
- focusing more blog articles on the biggest questions that new subscribers to Measure Up ask me
- using a framework (called Pink Sheets) to write richer, deeper content for blog articles
- being more deliberate in using keywords and keyphrases that people are using when they search, in my articles
- designing the meta data on each blog post to make it easier for Google to index it and searchers to click it
It seems to have had an effect, triggering the third signal in New Website Visits, of a steeper growth trend:
Happy days.
What’s next for the New Website Visits KPI?
Of course I would love to have even more new visitors to my website. And ideally those who are the people that value what I value: proper performance measurement. So I’m not interested in just randomly getting anyone to visit my website. It’s time to turn to other KPIs.
The next step for growing New Website Visits is to focus on improving the performance baselines of a few of its driver KPIs, such as:
- Average Google Ranking – which indicates if more people are seeing my website in their search results
- Average Visit Time – which indicates if my site’s content is engaging, and influences the Google ranking
- Page Views per Visit – which indicates if there is enough relevant content on my site, and also influences the Google ranking
And if that works, we’ll see another signal in the trending XmR chart!
To improve performance in trending KPIs, like New Website Visits, trending XmR charts make the signals crystal clear.
[tweet this]
Join Measure Up
Sign up for the Measure Up newsletter and get free access to the "10 Secrets to KPI Success" online course and e-book.

Upcoming KPI Training
All our PuMP training options have moved to PuMP Academy.


Connect with Stacey
Haven’t found what you’re looking for? Want more information? Fill out the form below and I’ll get in touch with you as soon as possible.
167 Eagle Street,
Brisbane Qld 4000,
Australia
ACN: 129953635
Director: Stacey Barr