The Minimalist Method For Customer Surveys
by Stacey Barr |Do your customers fall asleep before they get to the end of your feedback survey? Do they rush through without thinking carefully about your questions, because it’s just taking too long? Do you collect loads of feedback on a dozen or more questions, but fail to put it to good use? You definitely need a bit of ‘survey zen’.

There are several levels of results that matter about how our products and services impact on our customers and clients. Results about their reactions to our products and services, changes to their attitudes and knowledge and skill, their implementation of our recommendations, the business impact of implementing our recommendations, and the return they get relative to the investment they made in our products or services.
Here we’ll focus on the simplest and most commonly measured of these levels of customer impact: their reactions to our products and services. Despite being the most commonly measured, there remain some challenges to measuring it well.
One of the challenges of measuring reactions is deciding what questions to ask to collect the data needed. Too many feedback forms (a.k.a. happy sheets) ask too many questions. The consequences include getting data from time-poor and disinterested customers, and rarely putting all the data to good use.
I prefer a minimalist approach to asking for reactions from customers who attend my training workshops. My feedback form for the PuMP Blueprint Workshop is A5 in size, and asks just four questions:
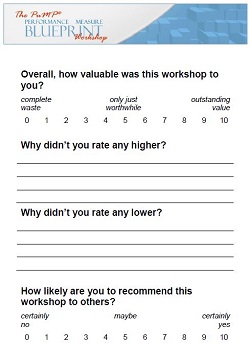
Question 1: Overall, how valuable was this workshop to you?This is measured on a 0 to 10 point scale, where I label the 0 as ‘complete waste’, the 5 as ‘only just worthwhile’ and the 10 as ‘outstanding value’.
Question 2: Why didn’t you rate any higher? This is an open-ended question, where I provide 4 lines for participants to write whatever comes to mind. The answers are a good insight into where participants felt the value fell short.
Question 3: Why didn’t you rate any lower? This is also an open-ended question and the answers are great insight into what participants most valued about the workshop.
Question 4: How likely are you to recommend this workshop to others? This data is collected specifically for the Net Promoter Score measure. It’s a 0 to 10 point scale, and this helps me understand the balance between people likely to promote the workshop to others and people likely to speak negatively about it.
Two of these questions provide the exact data I need for two of my operational performance measures for the PuMP Blueprint Workshop: Overall Value and Net Promoter Score. The other two questions provide some qualitative richness that I read, categorise, and use to find themes about the workshop’s biggest strengths and biggest opportunities to improve.
All this data is directly useful to me, and I do use it. Here’s how I track the measure of Overall Value:

Overall Value started out at a very consistent average of 8.6 out of 10, but I made an improvement to the workshop that lifted that average to 8.8. Ironically, the change was introducing XmR charts as a deliberate step in the PuMP Blueprint (changing the model from 7 steps to 8 steps).
While it’s too early to call it a true signal, the run of six workshops below the Central Line is interesting. I looked at the data and noticed all these workshops were either in-house workshops or workshops hosted and promoted by clients. These workshops always score a little lower than the public workshops I host and promote. The most likely reason for this is that the people who come to my public workshops are readers, just like you. They already know about me and my take on performance measurement, and are therefore already closely aligned to the principles the PuMP Blueprint Workshop is based on.
Net Promoter Score (NPS) is calculated from Question 4 as the percentage of customers who are Promoters (rate 9 or 10) and subtract the percentage who are Detractors (rate 6 or less). I only started measuring this since 2007.

As you can see, it is much more variable than Overall Value, largely due to its sensitivity to even a single low rating in small samples. Yep, 34 out of 794 respondents over the last 8 years rated less than 7 for how likely they are to recommend it to others! Perfection is very elusive.
The PuMP Blueprint Workshop Net Promoter Score chart showed a signal that around May 2012 that a higher proportion of participants were Promoters. The NPS baseline shifted from 59.8% to 76.2%. Compared to Fortune 500 companies’ NPS values, I’m not complaining.
For Questions 2 and 3, the data is completely qualitative but I do analyse it to find themes which have helped me prioritise improvements to the workshop design and delivery, and to base my marketing on authentic, evidence-based strengths of the workshop. If there’s enough interest expressed in the comments on this article, I’ll write another article about analysing and using qualitative data like this.
For me, my minimalist feedback data is largely responsible for the continual refinement of the PuMP Blueprint Workshop. It’s not the only data I rely on (I do pay close attention to my own subjective awareness of recurring themes from observing workshop dynamics). But, as simple as my minimalist feedback form is, it’s a huge part of the reason why the workshop is spreading further around the world every year, and helping more and more people end their performance measurement struggles.
Can you say the same about your customer feedback surveys?
TAKE ACTION:
What data do you collect about customer reactions to your products or services? Do you really need to collect all of it? What do you do with that feedback data? Is it a desperately useful input into your process improvements? How well linked is your survey data to your performance measures?
Join Measure Up
Sign up for the Measure Up newsletter and get free access to the "10 Secrets to KPI Success" online course and e-book.

Upcoming KPI Training
All our PuMP training options have moved to PuMP Academy.


Connect with Stacey
Haven’t found what you’re looking for? Want more information? Fill out the form below and I’ll get in touch with you as soon as possible.
167 Eagle Street,
Brisbane Qld 4000,
Australia
ACN: 129953635
Director: Stacey Barr