How to Measure the Performance of Webcasts
by Stacey Barr |My team and I host a lot of webcasts as part of our engagement process. Here’s the story about the results we want, how we measure them, and how performance is tracking.

The webcasts I co-host with my four regional PuMP Partners each quarter are the focus of this case study. These webcasts are free, content-rich, and designed to help our followers understand enough about PuMP to decide to come and learn it.
So, our ultimate outcome of these webcasts is registrations to our PuMP training programs. There are other wonderful outcomes too, like re-engaging our existing PuMP community and still offering practical help to those who cannot get to PuMP training, for whatever reason. But these are not our primary purpose.
The ideal result we want from our webcasts is this: our PuMP workshops sell out. With that as our context, it’s easier to work out what results we want, specifically, from the various stages of our webcast process.
The results we want from our webcasts…
Our hypotheses for webcast success is this:
- The more relevant and interesting the webcast topic and title, the more people will view the invitation and details.
- The more people that view our webcast invitation and details, the more that will register for our webcasts.
- The more people that register for our webcasts, the more will join us live.
- The more people that join us live for the webcasts, and stay engaged right to the end, the more likely our PuMP workshops will fill up.
These hypotheses translate into a selection of goals, which we articulate as measurable webcast performance results, using PuMP’s Measurability Tests.
These webcast performance results are then organised into a ‘slice’ of a PuMP Results Map, which is a small part of the overall strategy for my business. This webcast performance slice looks like this:
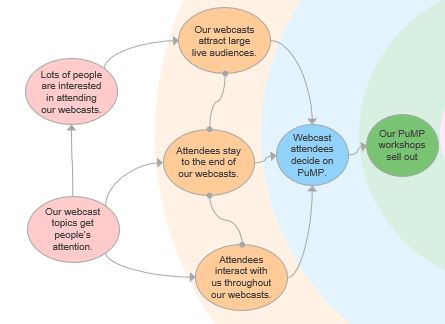
The Results Map normally does not have those rose-coloured result bubbles on the far left of the above diagram. In this case, they are diagnostic results that help drive actions to improve the actual performance results in the orange, blue and green layers. But all of the results are measured.
The measures we use to track our webcast results…
When you have clearly articulated, measurable performance results, designing meaningful measures is much easier. But we still used PuMP’s Measure Design technique to make sure we chose the most relevant and feasible measures for each webcast performance result.
The measure names are added to the Results Map, as follows:
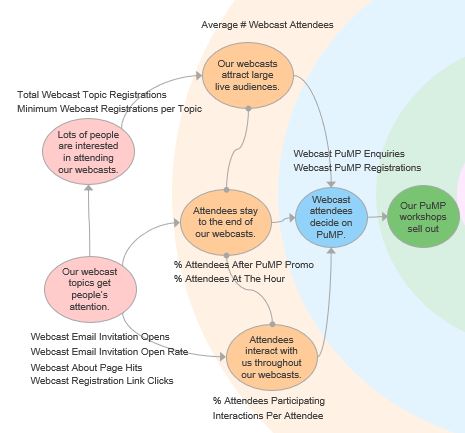
Measure names don’t often mean much to people not involved in creating them, so here they are, listed with their descriptions of how they’re calculated:
- Webcast Email Invitation Opens: The number of email subscribers who opened the webcast invitation email
- Webcast Email Invitation Open Rate: The percentage of email subscribers who opened the webcast invitation email
- Webcast About Page Hits: The number of hits on the webcast ‘about’ page, which contains the registration link
- Webcast Registration Link Clicks: The number of people, from social media and email, that clicked the link to register for the webcast (even if they did not complete their registration)
- Minimum Webcast Registrations per Topic: Minimum webcast registration count for each webcast topic series
- Total Webcast Topic Registrations: Total registrations for each webcast topic series
- Average # Webcast Attendees: The average number of attendees per webcast, for each webcast topic series
- % Attendees Participating: Percentage of attendees that either participated in a poll or posted a question or comment during the webcast
- Interactions Per Attendee: Average number of interactions (polls or comments or questions) per webcast attendee
- % Attendees At The Hour: Percentage of webcast attendees that are still online with us up to the hour mark
- % Attendees After PuMP Promo: Percentage of webcast attendees that are still online with us after we have delivered the PuMP promo
- Webcast PuMP Enquiries: Percentage of webcast attendees that enquire about PuMP training
- Webcast PuMP Registrations: Number of PMBW registrants that come from webcast attendees and their organisations.
We track each of these measures in an PuMP’s favourite measure visualisation, the XmR chart.
How our webcasts are performing…
The XmR charts for our webcast performance measures help us easily identify the impact of improvements we make to any part of our new webcast process. Here are two of our measures for the last two years:
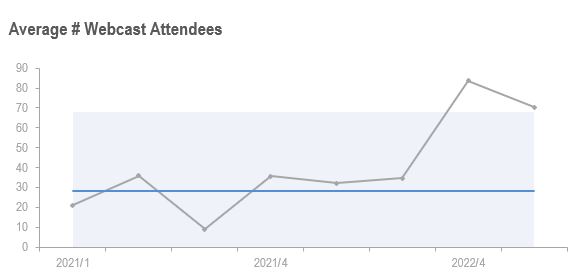
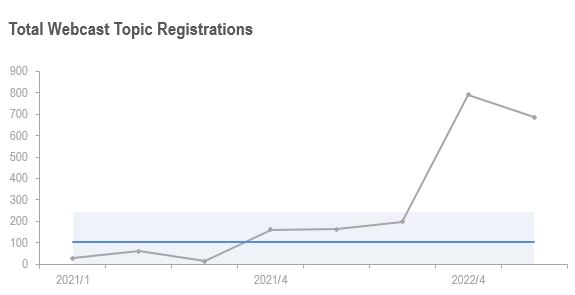
It wasn’t until later in 2021 that we shifted to an organised plan for our promotional webcasts. Prior to that, each of my PuMP Partners would choose a topic they liked and when they wanted to do it. It was a lot more work for me to develop webcasts ad hoc. Even though there are no official signals, the charts suggest systematising was a good idea.
And then in late 2022, we changed to an easier registration process for people to get into the webcasts. That clearly had a very desirable impact.
Of course, we’re tracking the other measures listed above too, to get more insight into how to make our webcasts serve both our followers interested in better performance measurement, as well as our goal to have more of the world trained in PuMP.
It’s really not that hard to measure what matters…
Hopefully, this case study shows you that using a clear and logical thinking process can easily lead you to performance measures that are very helpful and very effective in guiding true improvements. That’s largely what PuMP is: a clear and logical thinking process for more easily and meaningfully measuring what matters.
Join Measure Up
Sign up for the Measure Up newsletter and get free access to the "10 Secrets to KPI Success" online course and e-book.

Upcoming KPI Training
All our PuMP training options have moved to PuMP Academy.


Connect with Stacey
Haven’t found what you’re looking for? Want more information? Fill out the form below and I’ll get in touch with you as soon as possible.
167 Eagle Street,
Brisbane Qld 4000,
Australia
ACN: 129953635
Director: Stacey Barr