The 5 Most Useful Business Questions to Direct Your Analytics
by Stacey BarrAnalytics doesn’t magically produce insights from data like rabbits out of hats. To be worthwhile, analytics must be directed by deliberately chosen and strategically important business questions.

The promise that many analytics apps make about pulling insights out of data isn’t too far from pulling rabbits out of hats. It seems like magic: just connect your data sources to the analytics app, and magic starts to happen. Of course, it doesn’t. Those promised insights don’t come for two big reasons:
- We don’t have enough of the data we need, and we have too much of the data we don’t need.
- We don’t have enough time for the infinitely possible ways to slice, dice, correlate, summarise, and model the data.
The assumptions that analytics apps make are that the data we have will contain the insights we need, and we know exactly what to ask the app to do to get those insights. We have to work around these assumptions to get worthwhile value from analytics. And it starts with questions.
Analytics only works when it starts with the right questions.
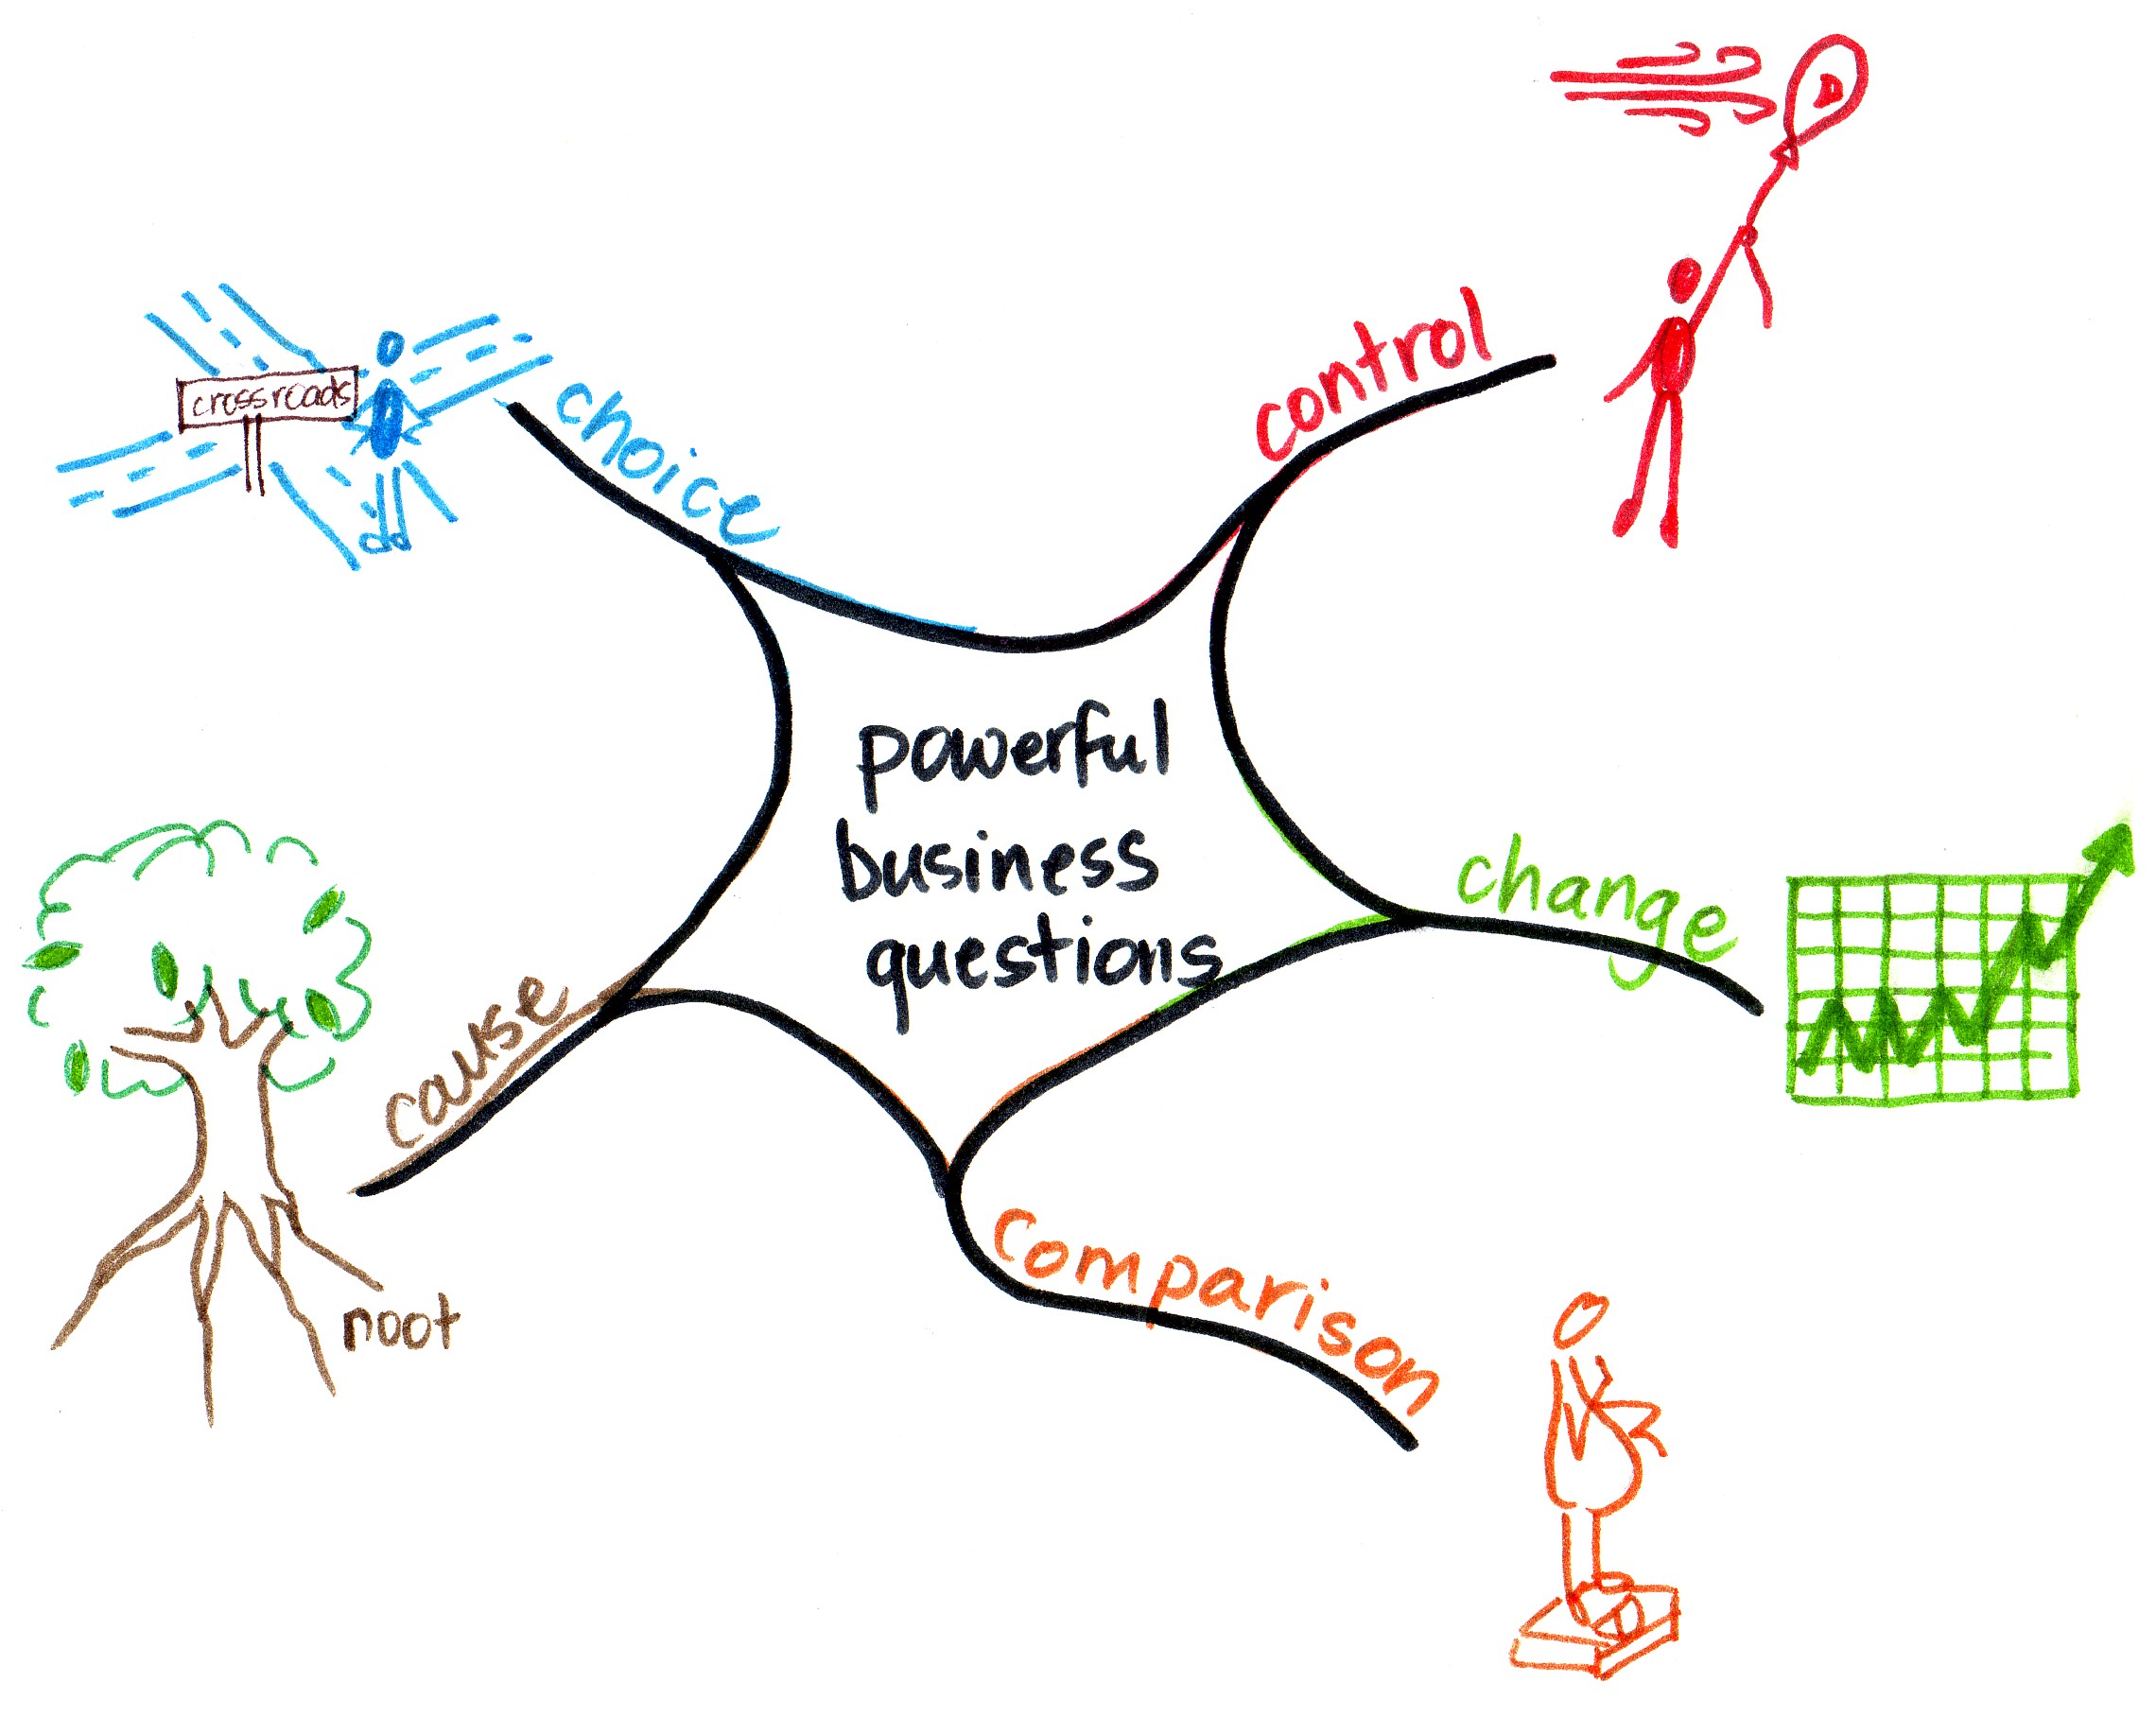
Asking the right types of business questions helps us use analytics for our priority performance issues. The following framework of five powerful business questions is a great way to focus our performance data analytics on producing relevant insights from relevant data.
Shall we take a little dive into each question?
Question 1: Do we have control over our performance results?
It’s a waste to improve something until we have sufficient control over the system or process that produces it. Imagine, for example, we’re measuring project performance. One of the KPIs, % Milestones Completed On-Time, is in complete chaos. That chaos might be because we have no consistent project implementation framework or system. No improvement initiative will work until we first establish a consistent system for implementing projects.
We have to first answer the question “do we have control over the performance results?” before it makes sense to answer any other question through analytics. Without control, improvement efforts are diluted at best and a complete waste at worst.
Analytic techniques that answer this question about how much control we have over performance results will show us the overall patterns of variation in our results through time. Line charts, and particularly XmR charts, are the perfect tools for seeing patterns in variation over time. Gaining control means removing the chaos and unpredictability in those patterns of variation over time, by putting in controls like policies and standard practices.
Question 2: Is there any change in our performance results?
With a performance result that we have control over, change (usually by way of improvement) is possible. To check if performance results are changing the way we expect them to (or not), we need an analysis technique that can show us, as time goes by, three specific things:
- when results are changing
- how much they are changing
- how slowly or quickly they are changing
This analysis technique has to filter out the real changes, from the typical ongoing ‘noise’ that can sometimes trick us into thinking there’s been a change. The best tool (possibly the only tool) that does this quickly, easily, validly and visually is the XmR chart. What we’re doing is looking for a standard set of three signals in our data.
Question 3: Which comparisons put the performance result into context?
Very rarely do we want to change a performance result for the sake of change, or to keep changing it without some limit or target. That’s the reality for organisations that don’t have unlimited resources! So often we will ask the question “are we there yet?” and “is this still where we need to be?”
This means we need analysis techniques that will highlight the comparison between where performance results are currently at, where performance results should be, and what else is being affected by trying to make this change.
Firstly, XmR charts do a great job of helping us track progress against our targets. If we’re happy with the progress, we don’t need to dig any deeper with analytics. But if we’re not happy with the progress, analytics can help us find out what’s holding improvement back. But we don’t want to dive into cause analysis, and end up blindly sabotaging other important performance results. For example, we don’t want to blindly increase the % Milestones Completed On-Time measure at the expense of % Milestones Completed On-Budget or Project ROI.
Instead, we first dig into a little more context about what related performance measures are doing. A Results Map is a great way to scope which other related performance measures we should look at. Particularly the conflict relationships. And our analytics app can help us look at correlations, to check if there are any signs that improving the performance result we’re focusing on might cause another result to suffer.
Question 4: What are the causes of the results we are currently getting?
We only move to question 4 if we discover that our performance results are not where we want them to be. There’s no point diving into data analytics for performance results that are already on track. Especially not when other performance results are not on track.
Despite any effort we’ve already invested in trying to improve these underperforming results, our next powerful business question is “what is causing this performance result to be different to what we want?”
Cause analysis is what we need, and this is where we’ll spend the most time and effort in data analytics. We’re exploring our data now, forming hypotheses and using analytics to test each one, until we find practical insights. But we need to be careful to avoid analysis paralysis, a common problem with undirected analytics approaches.
There are a bunch of analytics techniques to help us find other factors that are at play, influencing what our performance result is doing, or is capable of doing. For example:
- Pareto analysis: what factors might have some effect on what our performance result is doing?
- Correlation analysis: how are the causal factors correlated with our performance result, and possibly hindering it?
- Drill-down analysis: where and when do the causal factors have their biggest impact on our performance result?
- Regression analysis: which causal factors best explain patterns in our performance result?
This is where analytics apps come into their own. Looking for causes that explain what’s holding our performance result back is a big process, and it’s a huge help to have tools to automate as much of it as possible.
Question 5: What are your choices for improvement?
When we understand the causes that are limiting our current performance result, our last powerful business question is to decide or choose which causes to fix. This means we decide what change or improvement
initiative we will give resources to, so we can get the biggest improvement in our performance result, within our resource limits.
Analytics techniques that are helpful here are those that help us predict different scenarios of improvement in our performance results, given different combinations of cause management strategies. This is basically predictive analysis:
- What would our performance result do if we changed the explanatory causal factors?
- Which changes to which explanatory factors suggest the biggest improvements in our performance result?
- For each scenario, what would it cost to change the explanatory factors, what would be the improvement in the performance result, and what would be the return on investment?
We then just choose the best scenario, and design a change initiative or improvement project for it. Then we implement it.
Then go back to question 1…
The job isn’t done until we know what effect our change initiative had in reality. Analytics can point us in a practical and useful direction, but it’s all just based on best estimates from the analysis we did, and the data we had available. We have to turn back to our performance measures to see what actually happened, and what return on investment we actually got. So back to question 1 we go.
Analytics doesn’t magically produce insights from data like rabbits from hats. It must be directed by deliberately chosen and strategically important business questions.
[tweet this]
ACTION:
Review your current approach to analytics, with these 5 questions in mind, and see what’s missing and what might make analytics easier, faster and more useful in your organisation.
Join Measure Up
Sign up for the Measure Up newsletter and get free access to the "10 Secrets to KPI Success" online course and e-book.

Upcoming KPI Training
All our PuMP training options have moved to PuMP Academy.


Connect with Stacey
Haven’t found what you’re looking for? Want more information? Fill out the form below and I’ll get in touch with you as soon as possible.
167 Eagle Street,
Brisbane Qld 4000,
Australia
ACN: 129953635
Director: Stacey Barr