7 Principles For KPIs That Drive Success
November 5, 2024 by Stacey Barr | Leave a Comment
How to ensure your KPI approaches embody the fundamentals for KPIs that lead to organisational success. (more…)
Filed Under: PuMP Academy
How to ensure your KPI approaches embody the fundamentals for KPIs that lead to organisational success. (more…)
Filed Under: PuMP Academy

KPI target setting is both science and art. Science, in that it has proven and logical steps. Art, in that it needs your own creative input too. (more…)
Filed Under: Setting Performance Targets

Many (most?) KPI performance dashboards fail to inform, because people jump the gun and focus too much on the app and not nearly enough on the KPIs. (more…)
Starting with too many KPIs still remains a huge mistake that too many people make. Experience still teaches us to start small when we start with KPIs. (more…)
Filed Under: Getting Buy-in, Getting Started, Implementing Performance Measures, PuMP Academy

Missing data for your KPIs could mean you're missing important signals. Here are 3 ways to handle missing data. (more…)
Filed Under: Data Collection and Integrity


When it's not possible to automate your performance measure or KPI's calculation, a spreadsheet is a good interim solution, if you follow these 5 tips for setting them up. (more…)...
Filed Under: Analytics and Data Analysis, Getting Started

My team and I host a lot of webcasts as part of our engagement process. Here's the story about the results we want, how we measure them, and how performance is tracking. (more…)
Filed Under: Example Measures & KPIs

Terminology with KPIs, performance management, OKRs and strategy often misaligns and confuses people. Here's how to build a glossary to make it all clear. (more…)
Filed Under: Performance Leadership, Performance Office, PuMP Academy
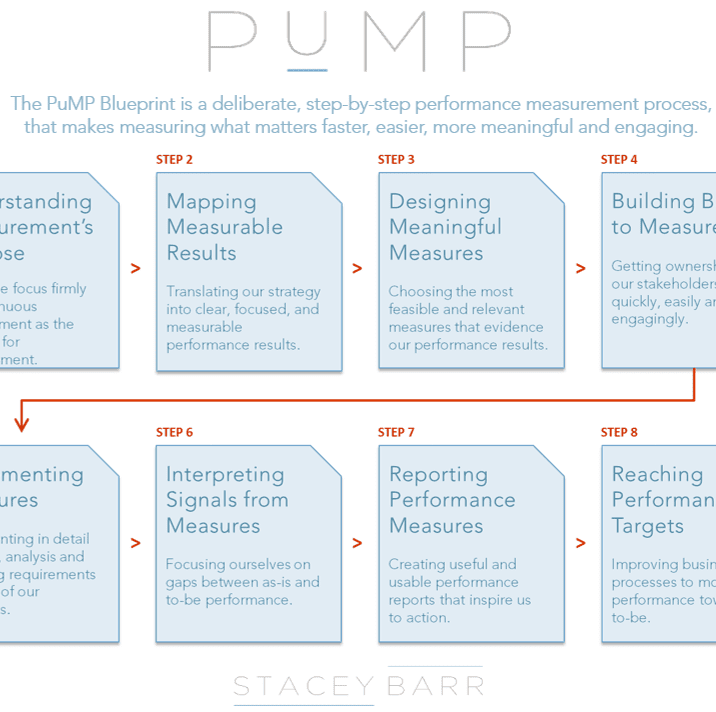
While this won't teach you how to implement PuMP for great KPIs, it will give you a snapshot of every thinking step in PuMP, that makes it such a great KPI methodology. (more…)
Filed Under: Performance Measurement Process
Sign up for the Measure Up newsletter and get free access to the "10 Secrets to KPI Success" online course and e-book.

All our PuMP training options have moved to PuMP Academy.

Haven’t found what you’re looking for? Want more information? Fill out the form below and I’ll get in touch with you as soon as possible.

