Five Steps For a Fast Performance Dashboard
by Stacey BarrMany (most?) KPI performance dashboards fail to inform, because people jump the gun and focus too much on the app and not nearly enough on the KPIs.

If a dashboard isn’t answering the right performance questions, people stop using it. Or they let it distract them away from the right performance questions. The app should not be the start, nor the focus, of a performance dashboard build.
You’ll get the dashboard you truly need a lot sooner by taking the quick and easy route to set up a simple, bare-bones dashboard that can do the job. If you invest heavily in expensive applications too soon, you’ll end up locked into popular dashboard designs, not functional ones.
Instead, build your dashboard prototype using something easily available, like Microsoft Excel. That’s all we use to set up our first performance dashboards with PuMP. Think of it as the first iteration – it will help you see with more certainty what it should ultimately become.
To get your first performance dashboard iteration set up, five simple steps are all you need. Let’s explore them…
STEP 1: Focus only on 2 to 3 performance results or goals.
Stop trying to do it all at once, perfectly. It’s expensive, it’s time-consuming, it’s momentum-sapping. Build the first iteration with a focus on two or three carefully selected performance results or goals.
To make sure you build momentum that you can maintain, select goals that are:
- clearly and specifically worded, and not vague or ambiguous, so the team has a shared understanding of exactly what they mean
- important or urgent enough to motivate the team to follow through with the dashboard and use it to help achieve those goals
- likely to have a range of available data relating to them, so when the team chooses measures, they won’t spend too much time in sourcing data
A great tool to help any team map out the goals or results that matter is PuMP’s Results Map. The Results Map captures all the performance results that matter to the team and aligns them to the corporate strategy. It will help the team select the goals to choose for the fast performance dashboard project, and also help them keep track of the next goals to add to the dashboard.
STEP 2: Choose a few performance measures for those priority results or goals.
There’s no prize for using all the KPIs you can think of to track a particular performance result. In fact, there’s a penalty and it’s your attention being spread too thin to make any kind of performance improvement at all. Or your attention being pulled away from your unique priorities. Think narrow and deep. Go for truly relevant and insightful performance measures.
If you ever get stuck and can’t figure out what the best measures are for a performance result, PuMP’s Measure Design technique works a treat. It makes you think about what your result really looks like in tangible terms, and that’s the key to finding the right measures.
STEP 3: Define exactly how those priority measures are calculated, and from what data.
Lame measure names won’t cut it. “Customer Loyalty” isn’t a performance measure. “The percentage of customers who have purchased from us more than 3 times in the past 6 months” is a measure.
One of the biggest time-wasters in setting up a performance dashboard is trying to figure out exactly how the measures should be measured. That sounds tautological, and it is. If you can’t figure out how to measure something with real data, then it isn’t a measure yet! Make sure you’re choosing real performance measures, which follow the recipe for writing a quantitative measure.
Then, before you start to build your fast performance dashboard, define each performance measure using PuMP’s Measure Definition technique, and keep these in a Performance Measure Dictionary.
STEP 4: List the data sources for priority measures, and set up links in your dashboard to that data only.
A lovely man I once knew, named Siva, had dozens (some say hundreds) of special spreadsheets where very key performance measure data was kept for the freight business he worked for. Only he knew how the spreadsheets worked, and where they were saved on the server. I know that he’s since left the organisation. Doesn’t it make you shudder to think of how long it took for his replacement to find and figure out how those spreadsheets worked?
My performance dashboard is built in Microsoft Excel, which for my company of one person, is inexpensive and easy. But most importantly for me, is that it links to a single core database for all my business data and measure definitions, and with queries for each KPI that update at the click of a button. This is still a manual process, but it lays the foundation for fully automating it the right way, if I ever go that far.
STEP 5: Systematically create the graphs in the dashboard for each priority measure, and arrange them on a single dashboard.
Forget about dials and gauges. Forget about pie charts and stacked bar charts. Forget about trying to use as many different charts as possible. (Even though it’s near impossible to find an example dashboard without these useless gizmos!) The most effective way to monitor your performance measures is with a line chart that tracks changes over time. That’s what you’re managing when you manage performance: moving performance closer and closer to target as time goes by.
And if you know what they are, or are open to what I’ve found to be the best way to visualise performance measures, use XmR charts instead.
I arrange my performance measure XmR charts onto my dashboard in segments that correspond to my priority performance results. After all, we’re using the measures to know if we’re achieving those results. My dashboard follows the PuMP design principles, and looks a bit like this:
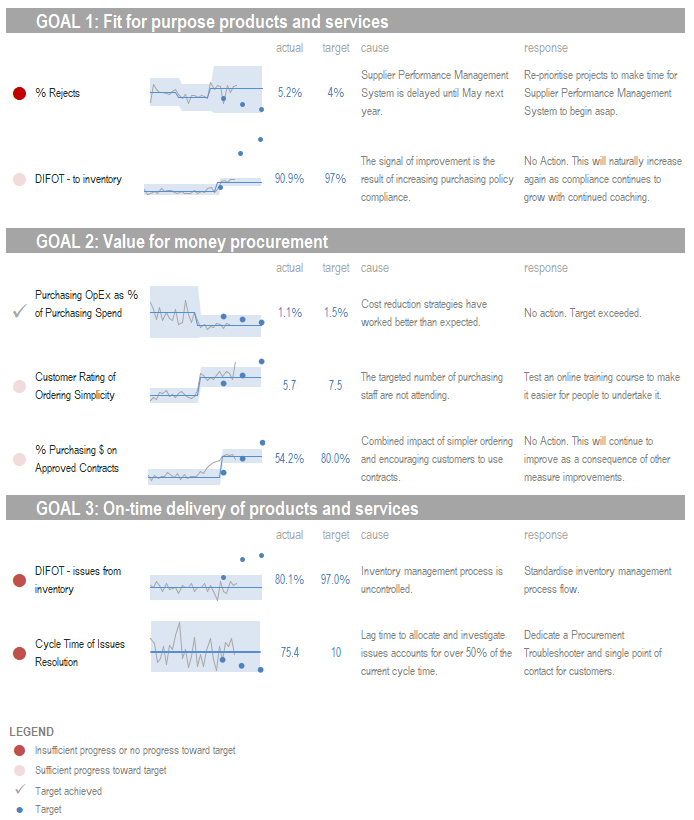
Voila: a fast performance dashboard, ready to use!
These five steps to a fast performance dashboard bring us quickly to the point where we can actively monitor a few of our most important KPIs. It gives us the chance to finetune our dashboard, and then move on to adding a few more priority performance results or goals, and appropriate KPIs for them. A fast performance dashboard, therefore, isn’t about rushing… it’s about iteration.
Join Measure Up
Sign up for the Measure Up newsletter and get free access to the "10 Secrets to KPI Success" online course and e-book.

Upcoming KPI Training
>> Australia/NZ/Asia Pacific, Wellington NZ, 7-9 May 2024
>> Africa, Cape Town SA, 8-10 May 2024
>> UK & Europe, Online Interactive, 10-14 June 2024
>> North America, Online Interactive, 3-7 June 2024
>> USA, Washington DC, 25-27 June 2024


Connect with Stacey
Haven’t found what you’re looking for? Want more information? Fill out the form below and I’ll get in touch with you as soon as possible.
167 Eagle Street,
Brisbane Qld 4000,
Australia
ACN: 129953635
Director: Stacey Barr