Principles to Design a PuMP Performance Dashboard
by Stacey BarrPerformance dashboards, unlike other dashboards, focus on closing performance gaps in strategic goals.
The ultimate purpose of a performance dashboard (versus other dashboards) is to improve performance, by reaching performance targets. It’s not for drill-down analysis; that’s an analytics dashboard. It’s not for day-to-day decision making; that’s an operational scanning dashboard.
A performance dashboard quickly and objectively answers three questions to help us close performance gaps to achieve our strategy: What is performance doing? Why is it doing that? What should we do about it?
But building a performance dashboard doesn’t start with technology. It starts with the right KPIs.
The pre-requisite for any performance dashboard is getting the right KPIs.
My North American PuMP Partner, Louise Watson, says the following in her article Demand Evidence Not Dashboards:
“The demand for a dashboard drives immediate action, but it doesn’t drive clarity of what the leader wanted to change or achieve… Demanding a dashboard decreases any chance that the team would pause and discover that useful and useable performance reports (ie. Dashboards) first need great measures, and great measures don’t just happen.”
If we want a good performance dashboard, we must start by putting the right evidence into the dashboard. Not what’s easily available. Not the good news ‘vanity metrics’. Not progress against actions.
No matter what level of the organisation we’re at, our performance dashboard must contain the KPIs or performance measures that we designed as the best evidence of the performance gaps in our strategically important goals. Then we can make it work.
The principles that make performance dashboards work.
Performance dashboard design is Step 7 of the 8-step PuMP methodology. And it’s based on a set of five principles.
#1 Design your dashboard to align to your strategy.
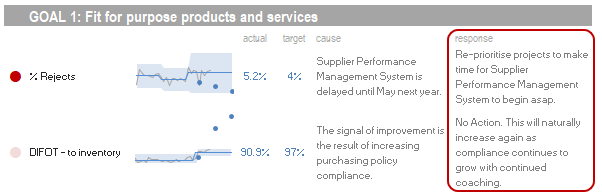
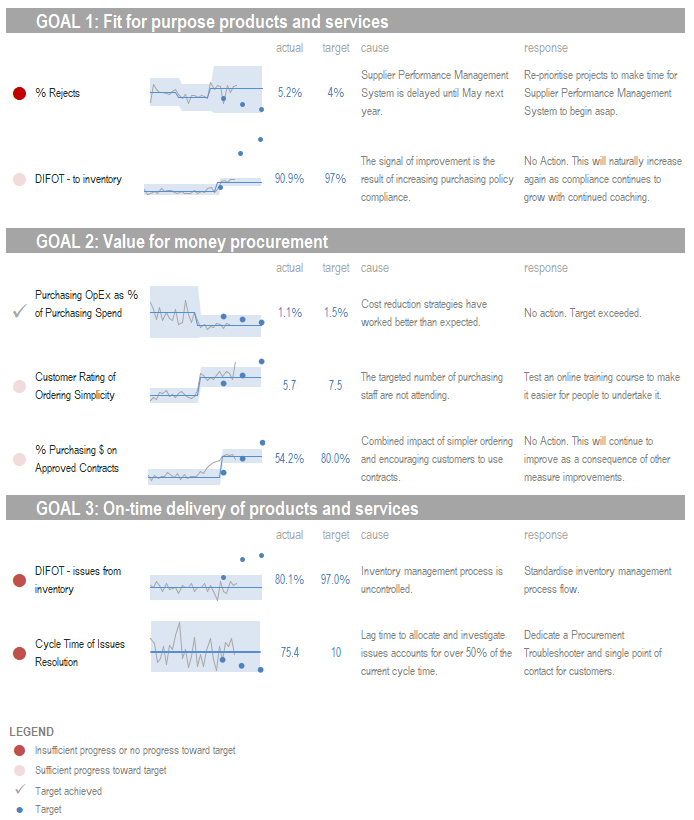
Because a performance dashboard is first and foremost focused on reaching strategically important goals, it must make it easy to see which evidence aligns with which goals. This is the key to designing the right structure for your performance dashboard.
In PuMP, we cluster KPIs under headings for each goal, like this:
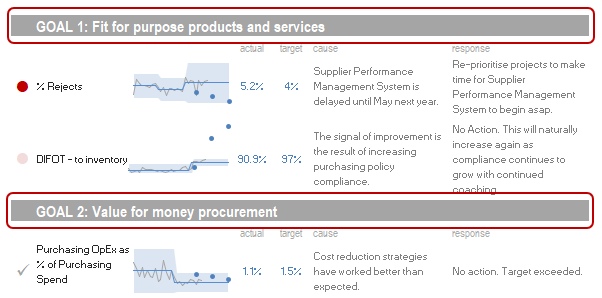
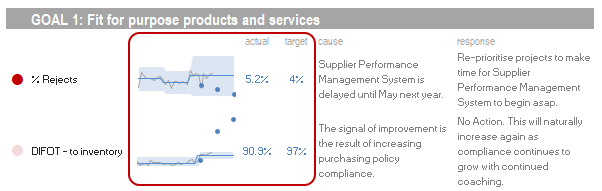
#2 Design your performance dashboard to objectively quantify performance gaps.
Performance gaps are the triggers for improvement action. They tell us which KPIs or measures most need our attention, and will therefore move us more swiftly toward our strategically important goals. A performance gap is the difference between current performance and desired future performance (i.e. a target).
In PuMP, we quantify performance gaps using XmR charts for each KPI. We use the central line as ‘current performance’ and we include dots for targets, above the dates by which we aim to achieve them.
#3 Design your performance dashboard to pinpoint causes.
Random conversations about how to respond to a KPI will only settle on the best action by sheer luck. If a performance dashboard does not include conclusions about the biggest causes holding open each KPI’s performance gap, we’ll end up guessing.
In PuMP, we include a very brief summary of the main cause that needs to be dealt with, to close the performance gap in each KPI. Yes, there will be more detailed cause analysis available, but that belongs in an analytics dashboard or report.
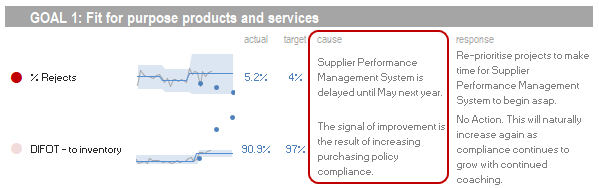
#4 Design your performance dashboard to link to action.
When causes are understood, action becomes much easier. Instead of implementing a favourite project or a solution that worked somewhere else, we can find the best response to a KPI’s performance gap. It’s like an hypothesis: if we do this action to remove this cause, we expect the performance gap to close.
In PuMP, we include a brief summary of the recommended action to deal with each KPI’s cause. This is a great place to link a performance dashboard to an action plan or project progress report.
#5 Design your performance dashboard to be easy and fast to use
In our PuMP workshops, we play a game called the 10-second test with some typically designed dashboards. It’s basically about how quickly you can find the performance gaps in a dashboard. All the typical dashboards fail. And one reason is because they are cluttered and ill-organised.
In PuMP, we use best-practice visual standards, inspired by Stephen Few, to make it easy and fast to understand the performance gaps in our performance dashboards. When you look at this example, what visual standards do you notice?
Do you have a real performance dashboard?
A great performance dashboard will quickly and objectively answer the questions to help you close performance gaps in your KPIs, to achieve your strategy. To do this, you must build it to have these five qualities:
- Focused on well-designed KPIs or performance measures that are the best evidence of your goals. [Don’t even bother with a performance dashboard until you have this!]
- Structured to group related KPIs or measures with the goal they provide evidence of.
- Centred around the quantification of performance gaps, or how far away each KPI’s current performance is from target.
- Supported by cause analysis that pinpoints the primary reason for each performance gap.
- Linked to deliberately chosen actions, directed at the causes, to close the performance gaps.
How many of these qualities do your current performance dashboards have?
Performance dashboards are about evidence for closing performance gaps, and nothing else. [tweet this]
Join Measure Up
Sign up for the Measure Up newsletter and get free access to the "10 Secrets to KPI Success" online course and e-book.

Upcoming KPI Training
>> Australia/NZ/Asia Pacific, Wellington NZ, 7-9 May 2024
>> Africa, Cape Town SA, 8-10 May 2024
>> UK & Europe, Online Interactive, 10-14 June 2024
>> North America, Online Interactive, 3-7 June 2024
>> USA, Washington DC, 25-27 June 2024


Connect with Stacey
Haven’t found what you’re looking for? Want more information? Fill out the form below and I’ll get in touch with you as soon as possible.
167 Eagle Street,
Brisbane Qld 4000,
Australia
ACN: 129953635
Director: Stacey Barr