Why KPI Thresholds Are a Really Bad Idea
by Stacey BarrKPI thresholds are not improvement tools; they make people react in a rush to quick fixes and gaming that end up making performance worse.

Thresholds are a bit like standards or targets in that they describe the level of performance we want. But unlike many standards or targets, thresholds are often set in ranges of acceptability. And these ranges are often coded in red, amber and green, like QuickScore do in their KPI app:
- red: current performance is unacceptable
- amber: current performance might need attention
- green: current performance is acceptable
A KPI with thresholds, in apps like QuickScore, looks like this one (source here):
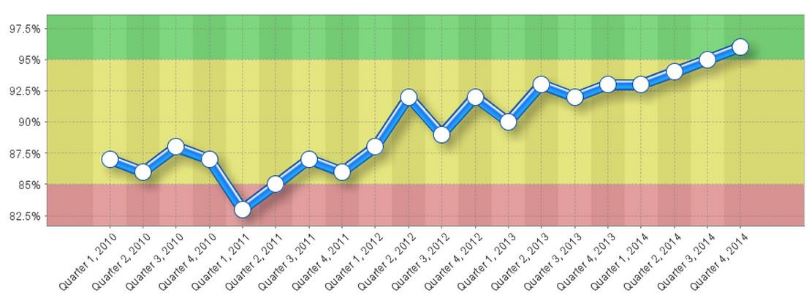
Imagine you’re watching a KPI from month to month (or whatever the measure’s cadence is). And suddenly you see the KPI value drop into the red zone. What do you do?
KPI thresholds will encourage you to react, rather than respond.
If your KPI drops into the red zone, you will likely rush to find out why and what needs to be fixed to quickly get it the heck out of there. But is that the right response?
Thresholds are set arbitrarily, often by the KPI owner, or informed by customer needs, or competitor benchmarks, or the strategic direction for the organisation. Rarely are KPI thresholds chosen in respect of the KPI’s current performance capability.
The problem with KPI thresholds is that they encourage us to compare the most current KPI value, like this month’s value, with the thresholds. This month’s value might fall in the red zone, the amber zone or the green zone. And how we feel and what we do depends on where it falls.
Often, humans forget to appreciate that there is a difference between current capability and desired capability. In an XmR chart, for example, the natural process limits describe our current capability only. Thresholds attempt to describe “should be” performance, while natural process limits describe “as is” performance. “Should be” is where we want performance to be and stay, but “as is” is where performance actually is right now.
And it’s this common human misunderstanding that creates the consequences of overcorrecting and undercorrecting of performance. In the worst case, it makes performance less predictable, less controllable, and less capable of ever getting into, and staying in, the green.
The way KPI thresholds trigger humans to feel and react is at the root of why thresholds are not improvement tools.
Why I don’t use KPI thresholds
In a nutshell, I don’t find them useful in driving the action that will improve performance.
I don’t want to be reactive to every single KPI value. I want to respond to patterns in my KPI’s variation over time. I want to do this, because I’d rather find an underlying limitation or problem and fix it once, to elevate performance to a new sustained level.
I call this type of response to KPIs “fundamental improvement“.
There are several reasons why KPI thresholds don’t support us to make fundamental improvements in performance…
KPI thresholds make us assume that performance is already capable of being green, rather than helping us understand reality.
Remember that thresholds are “shoulds” and not “cans”. When they are painted over a KPI time series, they suggest that the underlying process or system that the KPI measures should be able to hit green any time we choose. Like we should have this month. Or we absolutely must next month.
But the truth is, the current performance of any KPI is probably not good enough to always be in the green. That’s the main reason we measure something: because it needs improvement. Thresholds might work for measures that are already at the level we need them to be, when those thresholds are set to match the natural process limits of the measure, and used to interpret appropriate signals of change. Then we’re monitoring for deterioration, to catch it in time.
KPI thresholds distract us from understanding current performance capability, an essential pre-requisite for improving performance capability.
KPI thresholds drive gaming, rather than planned responses that produce sustained improvements.
When people feel they have to rush to find a fix and get the KPI out of the red as soon as possible, they will do whatever they can. That’s why we have a term in performance management known as gaming. Thresholds encourage people to manipulate the data or game the process to get next month’s KPI back into the green.
We should all be completely sick and tired of hearing about how sales people game the sales process to hit their quarterly quotas. They discount heavily, put pressure on customers, even bribe customers to buy. All the things that will put their sales into the green next quarter. But as customer loyalty and profit margins fall, it guarantees more red in the future.
No improvement lag timeframe is allowed for in KPI graphs with thresholds, even though improvement to shift current performance to a sustainable new level always takes time.
KPI thresholds encourage us to rush to fixes, rather than pacing us with enough time to make a fundamental performance improvement.
KPI thresholds are often combined with targets, which is just downright confusing.
If you add a target to a KPI that has thresholds, what on Earth does that mean? Thresholds are, themselves, a type of target. They are telling us where performance should be. That’s exactly what a target does.
But there is advice out there, from professional firms, saying it’s okay to add targets to KPIs that already have thresholds. Like this:
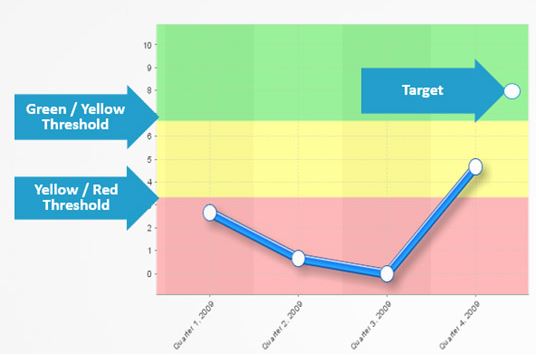
So, how exactly do we know when our KPI’s capability has lifted to the level we want it to be at? Is it when the current month lands in the green? Or when the current month is at or higher than the target point? And what happens if the
next month the KPI falls out of the green, or below the target point?
No system of KPI thresholds or targets will work unless it’s designed on a foundation of valid statistical theory.
There is simpler, valid, and more useful alternative to KPI thresholds.
Firstly, we need to be clear that when we measure something, we’re doing it because it’s important to improve it, or hold it at a required level.
Secondly, we need to be clear that performance is not defined by a single point, but by a pattern of variation. Variation is unavoidable in real-world phenomena, like performance results. It cannot be ignored. And this pattern of variation is the description of current capability, not this month’s value of the KPI.
Thirdly, we need to appreciate that fundamental improvement, where the underlying process being measured is improved, takes time. Reaching a target of any kind happens in the future from when we set it. Not next month.
So the best way to set up a system of monitoring KPIs for improvement is to do three things:
- Use a statistically valid graphical tool to see the pattern of variation in your KPI over time. It’s called an XmR chart.
- Set targets for either the central line or the natural process limits for a KPI’s XmR chart. This takes account of the natural variability.
- Interpret change in the KPI over time by looking for valid signals, recalculating the central line and the natural process limits when a valid signal has occurred, and comparing the new ones to the target.
It’s not that hard to do it right. Don’t listen to the BI software developers who can build colourful graphs. Listen to the experts who understand how to get insights from data.
KPI thresholds are not improvement tools; they make people react in a rush to quick fixes and gaming that end up making performance worse.
[tweet this]
TAKE ACTION:
Why not create a second version of your KPI in an XmR chart with a PuMP-style target, then notice the difference in how people feel about the KPI, and how they interpret it and respond to it?
Join Measure Up
Sign up for the Measure Up newsletter and get free access to the "10 Secrets to KPI Success" online course and e-book.

Upcoming KPI Training
All our PuMP training options have moved to PuMP Academy.


Connect with Stacey
Haven’t found what you’re looking for? Want more information? Fill out the form below and I’ll get in touch with you as soon as possible.
167 Eagle Street,
Brisbane Qld 4000,
Australia
ACN: 129953635
Director: Stacey Barr