The 7 Performance Signals to Look For in Your KPIs
by Stacey Barr |The simple secret to prioritising the KPIs that need your attention is to monitor the size and direction of the gap between current performance and targets.

Your performance measures are there to give you advice about what is going on in your business so you can choose the most appropriate way to manage its performance. This means that you will choose different types of actions depending on what kind of advice your measure is giving you, or, what kind of signal it’s giving off.
Improving performance is about closing performance gaps. There are several ways to explain what a performance gap is:
- the difference between as-is performance and should-be performance
- the difference between the current level of performance and the target
- how far away we are now from where we want to be
Our KPI signals each have a specific level of urgency, depending on the size and direction of the performance gap. And this helps us prioritise which KPIs to give our limited attention and resources to.
Prioritise each measure, and only fix the urgent ones first.
How many beanbags can be juggled at the same time?
The world record is 14 beanbags, set by Alex Barron in 2017. He only managed to hold on for a few seconds, enough to catch each beanbag once.
Improving performance is like juggling beanbags too, as we can only handle so much at any one time. Real-world limits on our attention, resources, and energy make certain of that.
But we need our improvements to hold for longer than a few seconds, so we’re better off trying for far less than 14 at once. The moral of this story is that it’s not realistic to try and improve all of our KPIs all at once! This is what my LinkedIn connection, Kyle, means when he wisely says:
“Reminds me of the saying ‘improving everything isn’t the same as everything is improving.’ Focus on what needs to be improved, improve it, ensure it can be sustained and then move on to the next thing to improve.” – Kyle from LinkedIn
The 7 signals set our KPI priorities.
There are seven important performance signals you’ll want to look for, and be prepared to respond to when you see them:
Signal 1: Performance is unpredictable or chaotic
When performance is unpredictable you’ll see it fluctuating wildly with very large variability from week to week or month to month, with no steady and consistent pattern of randomness.
This chaotic KPI behaviour is symptomatic of a business process that is out of control because it lacks standardisation in the process steps or the inputs used.
ACTION: Don’t try to improve performance. You need to get it under control first.
Signal 2: Performance is worsening
Depending on your performance measure, worsening performance might be evidenced by an upward trend or shift, as in the case of Expenditure or Rework Hours, or by a downward trend or shift, as in the case of Customer Satisfaction or Profit.
When we use XmR charts, we see this as a long run or short run signal, that moves the performance baseline away from the target.
ACTION: If you can pinpoint when the worsening in performance began, you have a better chance of finding out why, and taking successful action to turn the trend around.
Signal 3: Performance is stable and not changing
Performance values will always vary to some extent, and variation does not necessarily mean change. If your performance measure values are varying consistently within the same band or range, and you don’t see any values breaking away from this consistent but random pattern over time, the measure is signalling that nothing is changing.
In our KPIs’ XmR charts, it’s a lack of any of these three signals that tells us performance isn’t changing.
ACTION: Sometimes no change in performance is good, when it’s already at the target level. But it’s not good if you expected or planned to see improvement, like after you implemented a change initiative.
Signal 4: Performance is improving, but not fast enough to reach the target
All improvement in performance is good, when it’s planned. But sometimes the improvement is not big enough or fast enough to reach the planned targets.
If the targets still matter, and your measure is signalling that the improvement rate won’t be fast enough to reach the target in time, you need to intervene.
ACTION: Find out what’s still holding performance back, despite your previous efforts, and then allocate more resources to continue closing the performance gap. Or maybe the target was just for inspiration, and the improvements
achieved so far are a win anyway?
Signal 5: Performance is improving at a rate fast enough that the target will likely be met
This is a good signal! That you measure is indeed tracking confidently toward its target level of performance is a great sign that your strategies and improvement projects aimed at reaching the target are working.
But such signals are not a sure sign, because just as extraneous factors can cause a deterioration performance beyond your control, they can also cause an improvement in performance beyond your control too (just take the economy as an example in both cases).
ACTION: Don’t celebrate too early! Check that your actions were the real reason for reaching the target, and if they weren’t, be ready to respond if performance starts falling back again.
Signal 6: Performance has reached target
The best signal to get from your performance measures is that the target has been achieved. As with the signal of performance tracking confidently toward its target, this is a great sign that your strategies and improvement projects have worked.
Once again, though, such signals are not a sure sign, because of those extraneous factors outside your control.
ACTION: Check before you celebrate.
Signal 7: Performance has exceeded the target
Contrary to what you may think, exceeding a target is not better than meeting a target. It is a potential waste of resources and time that could have been better spent closing performance gaps in other important KPIs.
ACTION: Can and should resources be diverted to other KPIs that still have unacceptable performance gaps?
Use smart charts to make these signals clear.
The best way to be sure you can see these signals in your KPIs and performance measures is to present them with all of the following:
- Use a time series chart, at the very leas a line chart, and at best an XmR chart.
- Include at least 20 historic values, to be sure you have enough context and enough data to interpret the signals validly.
- Add your target as a point above the future date it should be achieved.
Then you’ll have a clear view of what’s really happening with performance, and you won’t make those rash and wasteful decisions from drawing conclusions based on weak “this month to last month” comparisons.
Is it about KPI performance gaps alone?
What about relative priority of the measures themselves? Which of these KPIs would you give resources to first:
- The least important KPI, which has Signal 2 (worsening performance)?
- The most important KPI, which has Signal 4 (improving but not fast enough)?
There is no purely logical way to answer that question. But when you’re faced with all your strategically important KPIs, you need to take account of their relative importance. The best way to think about their relative importance is to include a discussion about the consequences of each KPI missing its target.
Measuring performance is science, but using performance measures requires leadership.
Use your dashboard as your performance review agenda.
Are your KPIs and performance measures displayed in a way that can highlight these seven important performance signals?
If not, consider redesigning your performance report or dashboard like this one:
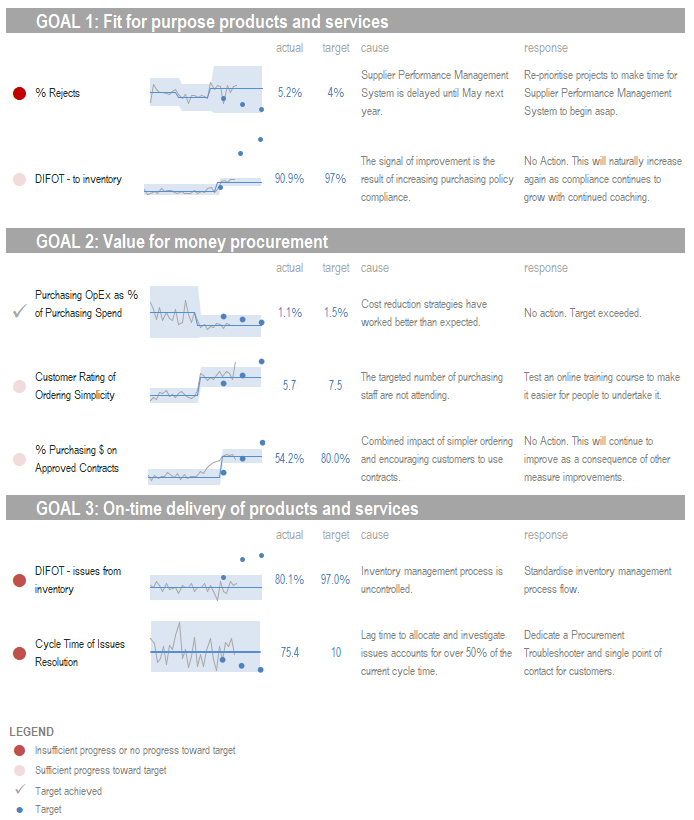
The size and direction of the gap between where performance is and where you want it to be is the key to prioritising KPI improvement. [tweet this]
Join Measure Up
Sign up for the Measure Up newsletter and get free access to the "10 Secrets to KPI Success" online course and e-book.

Upcoming KPI Training
>> Australia/NZ/Asia Pacific, Wellington NZ, 7-9 May 2024
>> Africa, Cape Town SA, 8-10 May 2024
>> UK & Europe, Online Interactive, 10-14 June 2024
>> North America, Online Interactive, 3-7 June 2024
>> USA, Washington DC, 25-27 June 2024


Connect with Stacey
Haven’t found what you’re looking for? Want more information? Fill out the form below and I’ll get in touch with you as soon as possible.
167 Eagle Street,
Brisbane Qld 4000,
Australia
ACN: 129953635
Director: Stacey Barr